TDA-C01日本語試験無料問題集「Tableau Certified Data Analyst (TDA-C01日本語版) 認定」

デスクトップにあるBook1へのリンクを開きます。「Movie Durations」ワークシートを開きます。
既存のデータ ソースを Netflix_2019 データ ソースに置き換えます。
既存のデータ ソースを Netflix_2019 データ ソースに置き換えます。
正解:
check the steps below in explanation.
Explanation:
To replace the existing data source with the Netflix_2019 data source, you need to do the following steps:
* Open the link to Book1 found on the desktop. This will open the Tableau workbook that contains the Movie Durations worksheet.
* Click on the Movie Durations tab at the bottom of the workbook to open the worksheet. You will see a bar chart that shows the number of movies by duration for the existing data source.
* Go to the Data Source tab at the bottom of the workbook to see the data source page. You will see a table that shows the fields and values from the existing data source.
* Click on the drop-down arrow next to the data source name at the top of the page and select Replace Data Source from the menu. This will open a dialog box that allows you to replace your data source with another one.
* Select Netflix_2019 from the list of available data sources and click OK. This will replace your existing data source with the Netflix_2019 data source and update your worksheet accordingly. You may need to fix any broken fields or calculations that result from the replacement.
References: https://help.tableau.com/current/pro/desktop/en-us/datasource_replace.htm https://help.tableau.
com/current/pro/desktop/en-us/datasource_replace_workbook.htm
Explanation:
To replace the existing data source with the Netflix_2019 data source, you need to do the following steps:
* Open the link to Book1 found on the desktop. This will open the Tableau workbook that contains the Movie Durations worksheet.
* Click on the Movie Durations tab at the bottom of the workbook to open the worksheet. You will see a bar chart that shows the number of movies by duration for the existing data source.
* Go to the Data Source tab at the bottom of the workbook to see the data source page. You will see a table that shows the fields and values from the existing data source.
* Click on the drop-down arrow next to the data source name at the top of the page and select Replace Data Source from the menu. This will open a dialog box that allows you to replace your data source with another one.
* Select Netflix_2019 from the list of available data sources and click OK. This will replace your existing data source with the Netflix_2019 data source and update your worksheet accordingly. You may need to fix any broken fields or calculations that result from the replacement.
References: https://help.tableau.com/current/pro/desktop/en-us/datasource_replace.htm https://help.tableau.
com/current/pro/desktop/en-us/datasource_replace_workbook.htm
デスクトップにある Book1 へのリンクを開きます。規律ワークシートを開きます。
テーブルをフィルターして、Top10 セットのメンバーと Bottom10 セットのメンバーを表示します。合計 20 行になるはずです。

テーブルをフィルターして、Top10 セットのメンバーと Bottom10 セットのメンバーを表示します。合計 20 行になるはずです。
正解:
check the steps below in explanation.
Explanation:
To filter the table to show the members of the Top10 set and the Bottom10 set, you need to do the following steps:
* Open the link to Book1 found on the desktop. This will open the Tableau workbook that contains the Disciplines worksheet.
* Click on the Disciplines tab at the bottom of the workbook to open the worksheet. You will see a table that shows the disciplines, sales, and profit for each salesperson.
* Click on the drop-down arrow next to Salesperson on the Filters shelf. This will open a menu that allows you to filter by different criteria.
* Select Set from the menu. This will show you the sets that are available for the Salesperson field. You will see Top10 and Bottom10 as two sets that have been created based on the sales ranking.
* Check the boxes next to Top10 and Bottom10. This will filter the table to show only the members of these two sets. You can also click on All to deselect all other values.
* Click OK to apply the filter. You will see that the table now shows 20 rows, 10 for each set.
References: https://help.tableau.com/current/pro/desktop/en-us/sets.htm https://help.tableau.com/current/pro/desktop/en-us/filtering.htm
Explanation:
To filter the table to show the members of the Top10 set and the Bottom10 set, you need to do the following steps:
* Open the link to Book1 found on the desktop. This will open the Tableau workbook that contains the Disciplines worksheet.
* Click on the Disciplines tab at the bottom of the workbook to open the worksheet. You will see a table that shows the disciplines, sales, and profit for each salesperson.
* Click on the drop-down arrow next to Salesperson on the Filters shelf. This will open a menu that allows you to filter by different criteria.
* Select Set from the menu. This will show you the sets that are available for the Salesperson field. You will see Top10 and Bottom10 as two sets that have been created based on the sales ranking.
* Check the boxes next to Top10 and Bottom10. This will filter the table to show only the members of these two sets. You can also click on All to deselect all other values.
* Click OK to apply the filter. You will see that the table now shows 20 rows, 10 for each set.
References: https://help.tableau.com/current/pro/desktop/en-us/sets.htm https://help.tableau.com/current/pro/desktop/en-us/filtering.htm


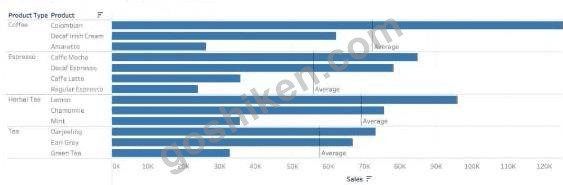
「カテゴリー」、「利益状況」、「顧客名」という4つのフィールドを持つデータセットがあります。次のビジュアライゼーションを作成する必要があります。

正解:

Explanation:
Sales: B. Columns
Profit: D. Rows
Customer Name: C. Detail on the Marks card
Category: A. Color on the Marks card
To create the visualization, you need to drag Sales to Columns, Profit to Rows, Customer Name to Detail on the Marks card, and Category to Color on the Marks card. This will create a scatter plot that shows the relationship between Sales and Profit for each Customer Name, with different colors for each Category.
References: https://help.tableau.com/current/pro/desktop/en-us/buildmanual_shelves.htm https://help.tableau.com/current/pro/desktop/en-us/buildexamples_scatter.htm
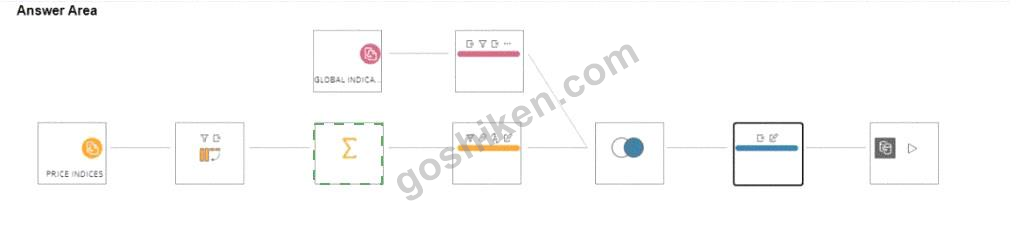
Global Indicators という名前のデータセットを Price Indices という名前のデータセットに結合する Tableau Prep フローがあります。
どのステップで月次データの行を年次データの行に変換できますか?

どのステップで月次データの行を年次データの行に変換できますか?
正解: