![]()
最新のSPLK-4001合格保証付き試験問題集の認定サンプル問題
最新SPLK-4001テスト材料には有効なSPLK-4001テストエンジン
質問 # 32
What is one reason a user of Splunk Observability Cloud would want to subscribe to an alert?
- A. To be able to modify the alert parameters.
- B. To perform transformations on the data used by the detector.
- C. To receive an email notification when a detector is triggered.
- D. To determine the root cause of the Issue triggering the detector.
正解:C
解説:
Explanation
One reason a user of Splunk Observability Cloud would want to subscribe to an alert is C. To receive an email notification when a detector is triggered.
A detector is a component of Splunk Observability Cloud that monitors metrics or events and triggers alerts when certain conditions are met. A user can create and configure detectors to suit their monitoring needs and goals1 A subscription is a way for a user to receive notifications when a detector triggers an alert. A user can subscribe to a detector by entering their email address in the Subscription tab of the detector page. A user can also unsubscribe from a detector at any time2 When a user subscribes to an alert, they will receive an email notification that contains information about the alert, such as the detector name, the alert status, the alert severity, the alert time, and the alert message. The email notification also includes links to view the detector, acknowledge the alert, or unsubscribe from the detector2 To learn more about how to use detectors and subscriptions in Splunk Observability Cloud, you can refer to these documentations12.
1: https://docs.splunk.com/Observability/alerts-detectors-notifications/detectors.html 2:
https://docs.splunk.com/Observability/alerts-detectors-notifications/subscribe-to-detectors.html
質問 # 33
Where does the Splunk distribution of the OpenTelemetry Collector store the configuration files on Linux machines by default?
- A. /opt/splunk/
- B. /etc/otel/collector/
- C. /etc/system/default/
- D. /etc/opentelemetry/
正解:B
解説:
Explanation
The correct answer is B. /etc/otel/collector/
According to the web search results, the Splunk distribution of the OpenTelemetry Collector stores the configuration files on Linux machines in the /etc/otel/collector/ directory by default. You can verify this by looking at the first result1, which explains how to install the Collector for Linux manually. It also provides the locations of the default configuration file, the agent configuration file, and the gateway configuration file.
To learn more about how to install and configure the Splunk distribution of the OpenTelemetry Collector, you can refer to this documentation2.
1: https://docs.splunk.com/Observability/gdi/opentelemetry/install-linux-manual.html 2:
https://docs.splunk.com/Observability/gdi/opentelemetry.html
質問 # 34
Changes to which type of metadata result in a new metric time series?
- A. Sources
- B. Properties
- C. Dimensions
- D. Tags
正解:C
解説:
Explanation
The correct answer is A. Dimensions.
Dimensions are metadata in the form of key-value pairs that are sent along with the metrics at the time of ingest. They provide additional information about the metric, such as the name of the host that sent the metric, or the location of the server. Along with the metric name, they uniquely identify a metric time series (MTS)1 Changes to dimensions result in a new MTS, because they create a different combination of metric name and dimensions. For example, if you change the hostname dimension from host1 to host2, you will create a new MTS for the same metric name1 Properties, sources, and tags are other types of metadata that can be applied to existing MTSes after ingest.
They do not contribute to uniquely identify an MTS, and they do not create a new MTS when changed2 To learn more about how to use metadata in Splunk Observability Cloud, you can refer to this documentation2.
1: https://docs.splunk.com/Observability/metrics-and-metadata/metrics.html#Dimensions 2:
https://docs.splunk.com/Observability/metrics-and-metadata/metrics-dimensions-mts.html
質問 # 35
Which of the following are supported rollup functions in Splunk Observability Cloud?
- A. sigma, epsilon, pi, omega, beta, tau
- B. std_dev, mean, median, mode, min, max
- C. 1min, 5min, 10min, 15min, 30min
- D. average, latest, lag, min, max, sum, rate
正解:D
解説:
Explanation
According to the Splunk O11y Cloud Certified Metrics User Track document1, Observability Cloud has the following rollup functions: Sum: (default for counter metrics): Returns the sum of all data points in the MTS reporting interval. Average (default for gauge metrics): Returns the average value of all data points in the MTS reporting interval. Min: Returns the minimum data point value seen in the MTS reporting interval. Max:
Returns the maximum data point value seen in the MTS reporting interval. Latest: Returns the most recent data point value seen in the MTS reporting interval. Lag: Returns the difference between the most recent and the previous data point values seen in the MTS reporting interval. Rate: Returns the rate of change of data points in the MTS reporting interval. Therefore, option A is correct.
質問 # 36
A customer has a large population of servers. They want to identify the servers where utilization has increased the most since last week. Which analytics function is needed to achieve this?
- A. Standard deviation
- B. Rate
- C. Sum transformation
- D. Tlmeshift
正解:D
解説:
Explanation
The correct answer is C. Timeshift.
According to the Splunk Observability Cloud documentation1, timeshift is an analytic function that allows you to compare the current value of a metric with its value at a previous time interval, such as an hour ago or a week ago. You can use the timeshift function to measure the change in a metric over time and identify trends, anomalies, or patterns. For example, to identify the servers where utilization has increased the most since last week, you can use the following SignalFlow code:
timeshift(1w, counters("server.utilization"))
This will return the value of the server.utilization counter metric for each server one week ago. You can then subtract this value from the current value of the same metric to get the difference in utilization. You can also use a chart to visualize the results and sort them by the highest difference in utilization.
質問 # 37
Which component of the OpenTelemetry Collector allows for the modification of metadata?
- A. Processors
- B. Receivers
- C. Exporters
- D. Pipelines
正解:A
解説:
Explanation
The component of the OpenTelemetry Collector that allows for the modification of metadata is A. Processors.
Processors are components that can modify the telemetry data before sending it to exporters or other components. Processors can perform various transformations on metrics, traces, and logs, such as filtering, adding, deleting, or updating attributes, labels, or resources. Processors can also enrich the telemetry data with additional metadata from various sources, such as Kubernetes, environment variables, or system information1 For example, one of the processors that can modify metadata is the attributes processor. This processor can update, insert, delete, or replace existing attributes on metrics or traces. Attributes are key-value pairs that provide additional information about the telemetry data, such as the service name, the host name, or the span kind2 Another example is the resource processor. This processor can modify resource attributes on metrics or traces.
Resource attributes are key-value pairs that describe the entity that produced the telemetry data, such as the cloud provider, the region, or the instance type3 To learn more about how to use processors in the OpenTelemetry Collector, you can refer to this documentation1.
1: https://opentelemetry.io/docs/collector/configuration/#processors 2:
https://github.com/open-telemetry/opentelemetry-collector-contrib/tree/main/processor/attributesprocessor 3:
https://github.com/open-telemetry/opentelemetry-collector-contrib/tree/main/processor/resourceprocessor
質問 # 38
Which of the following are correct ports for the specified components in the OpenTelemetry Collector?
- A. gRPC (4317), SignalFx (9080), Fluentd (8006)
- B. gRPC (4000), SignalFx (9943), Fluentd (6060)
- C. gRPC (4459), SignalFx (9166), Fluentd (8956)
- D. gRPC (6831), SignalFx (4317), Fluentd (9080)
正解:A
解説:
Explanation
The correct answer is D. gRPC (4317), SignalFx (9080), Fluentd (8006).
According to the web search results, these are the default ports for the corresponding components in the OpenTelemetry Collector. You can verify this by looking at the table of exposed ports and endpoints in the first result1. You can also see the agent and gateway configuration files in the same result for more details.
1: https://docs.splunk.com/observability/gdi/opentelemetry/exposed-endpoints.html
質問 # 39
A user wants to add a link to an existing dashboard from an alert. When they click the dimension value in the alert message, they are taken to the dashboard keeping the context. How can this be accomplished? (select all that apply)
- A. Add a link to the Runbook URL.
- B. Build a global data link.
- C. Add the link to the alert message body.
- D. Add a link to the field.
正解:B、D
解説:
Explanation
The possible ways to add a link to an existing dashboard from an alert are:
Build a global data link. A global data link is a feature that allows you to create a link from any dimension value in any chart or table to a dashboard of your choice. You can specify the source and target dashboards, the dimension name and value, and the query parameters to pass along. When you click on the dimension value in the alert message, you will be taken to the dashboard with the context preserved1 Add a link to the field. A field link is a feature that allows you to create a link from any field value in any search result or alert message to a dashboard of your choice. You can specify the field name and value, the dashboard name and ID, and the query parameters to pass along. When you click on the field value in the alert message, you will be taken to the dashboard with the context preserved2 Therefore, the correct answer is A and C.
To learn more about how to use global data links and field links in Splunk Observability Cloud, you can refer to these documentations12.
1: https://docs.splunk.com/Observability/gdi/metrics/charts.html#Global-data-links 2:
https://docs.splunk.com/Observability/gdi/metrics/search.html#Field-links
質問 # 40
An SRE came across an existing detector that is a good starting point for a detector they want to create. They clone the detector, update the metric, and add multiple new signals. As a result of the cloned detector, which of the following is true?
- A. You can only monitor one of the new signals.
- B. The new signals will be reflected in the original chart.
- C. The new signals will not be added to the original detector.
- D. The new signals will be reflected in the original detector.
正解:C
解説:
Explanation
According to the Splunk O11y Cloud Certified Metrics User Track document1, cloning a detector creates a copy of the detector that you can modify without affecting the original detector. You can change the metric, filter, and signal settings of the cloned detector. However, the new signals that you add to the cloned detector will not be reflected in the original detector, nor in the original chart that the detector was based on. Therefore, option D is correct.
Option A is incorrect because the new signals will not be reflected in the original detector. Option B is incorrect because the new signals will not be reflected in the original chart. Option C is incorrect because you can monitor all of the new signals that you add to the cloned detector.
質問 # 41
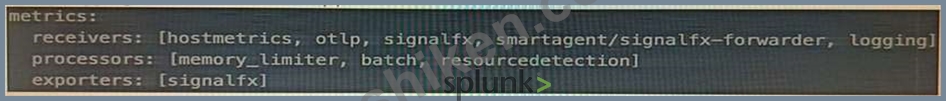
A customer is experiencing issues getting metrics from a new receiver they have configured in the OpenTelemetry Collector. How would the customer go about troubleshooting further with the logging exporter?
- A. Adding debug into the metrics receiver pipeline:

- B. Adding debug into the metrics exporter pipeline:
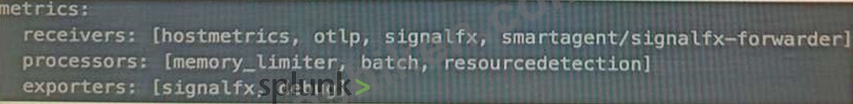
- C. Adding logging into the metrics exporter pipeline:
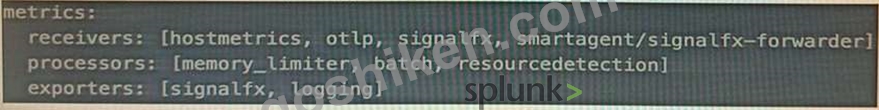
- D. Adding logging into the metrics receiver pipeline:
正解:D
解説:
Explanation
The correct answer is B. Adding logging into the metrics receiver pipeline.
The logging exporter is a component that allows the OpenTelemetry Collector to send traces, metrics, and logs directly to the console. It can be used to diagnose and troubleshoot issues with telemetry received and processed by the Collector, or to obtain samples for other purposes1 To activate the logging exporter, you need to add it to the pipeline that you want to diagnose. In this case, since you are experiencing issues with a new receiver for metrics, you need to add the logging exporter to the metrics receiver pipeline. This will create a new plot that shows the metrics received by the Collector and any errors or warnings that might occur1 The image that you have sent with your question shows how to add the logging exporter to the metrics receiver pipeline. You can see that the exporters section of the metrics pipeline includes logging as one of the options.
This means that the metrics received by any of the receivers listed in the receivers section will be sent to the logging exporter as well as to any other exporters listed2 To learn more about how to use the logging exporter in Splunk Observability Cloud, you can refer to this documentation1.
1: https://docs.splunk.com/Observability/gdi/opentelemetry/components/logging-exporter.html 2:
https://docs.splunk.com/Observability/gdi/opentelemetry/exposed-endpoints.html
質問 # 42
To smooth a very spiky cpu.utilization metric, what is the correct analytic function to better see if the cpu.
utilization for servers is trending up over time?
- A. Rate/Sec
- B. Mean (by host)
- C. Mean (Transformation)
- D. Median
正解:C
解説:
Explanation
The correct answer is D. Mean (Transformation).
According to the web search results, a mean transformation is an analytic function that returns the average value of a metric or a dimension over a specified time interval1. A mean transformation can be used to smooth a very spiky metric, such as cpu.utilization, by reducing the impact of outliers and noise. A mean transformation can also help to see if the metric is trending up or down over time, by showing the general direction of the average value. For example, to smooth the cpu.utilization metric and see if it is trending up over time, you can use the following SignalFlow code:
mean(1h, counters("cpu.utilization"))
This will return the average value of the cpu.utilization counter metric for each metric time series (MTS) over the last hour. You can then use a chart to visualize the results and compare the mean values across different MTS.
Option A is incorrect because rate/sec is not an analytic function, but rather a rollup function that returns the rate of change of data points in the MTS reporting interval1. Rate/sec can be used to convert cumulative counter metrics into counter metrics, but it does not smooth or trend a metric. Option B is incorrect because median is not an analytic function, but rather an aggregation function that returns the middle value of a metric or a dimension over the entire time range1. Median can be used to find the typical value of a metric, but it does not smooth or trend a metric. Option C is incorrect because mean (by host) is not an analytic function, but rather an aggregation function that returns the average value of a metric or a dimension across all MTS with the same host dimension1. Mean (by host) can be used to compare the performance of different hosts, but it does not smooth or trend a metric.
Mean (Transformation) is an analytic function that allows you to smooth a very spiky metric by applying a moving average over a specified time window. This can help you see the general trend of the metric over time, without being distracted by the short-term fluctuations1 To use Mean (Transformation) on a cpu.utilization metric, you need to select the metric from the Metric Finder, then click on Add Analytics and choose Mean (Transformation) from the list of functions. You can then specify the time window for the moving average, such as 5 minutes, 15 minutes, or 1 hour. You can also group the metric by host or any other dimension to compare the smoothed values across different servers2 To learn more about how to use Mean (Transformation) and other analytic functions in Splunk Observability Cloud, you can refer to this documentation2.
1: https://docs.splunk.com/Observability/gdi/metrics/analytics.html#Mean-Transformation 2:
https://docs.splunk.com/Observability/gdi/metrics/analytics.html
質問 # 43
For which types of charts can individual plot visualization be set?
- A. Histogram, Line, Column
- B. Line, Bar, Column
- C. Bar, Area, Column
- D. Line, Area, Column
正解:D
解説:
Explanation
The correct answer is C. Line, Area, Column.
For line, area, and column charts, you can set the individual plot visualization to change the appearance of each plot in the chart. For example, you can change the color, shape, size, or style of the lines, areas, or columns. You can also change the rollup function, data resolution, or y-axis scale for each plot1 To set the individual plot visualization for line, area, and column charts, you need to select the chart from the Metric Finder, then click on Plot Chart Options and choose Individual Plot Visualization from the list of options. You can then customize each plot according to your preferences2 To learn more about how to use individual plot visualization in Splunk Observability Cloud, you can refer to this documentation2.
1: https://docs.splunk.com/Observability/gdi/metrics/charts.html#Individual-plot-visualization 2:
https://docs.splunk.com/Observability/gdi/metrics/charts.html#Set-individual-plot-visualization
質問 # 44
Given that the metric demo. trans. count is being sent at a 10 second native resolution, which of the following is an accurate description of the data markers displayed in the chart below?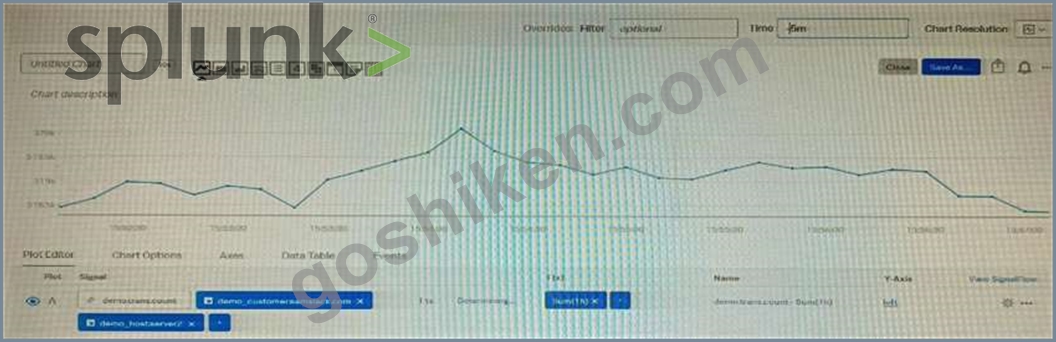
- A. Each data marker represents the 10 second delta between counter values.
- B. Each data marker represents the average hourly rate of API calls.
- C. Each data marker represents the sum of API calls in the hour leading up to the data marker.
- D. Each data marker represents the average of the sum of datapoints over the last minute, averaged over the hour.
正解:C
解説:
Explanation
The correct answer is D. Each data marker represents the sum of API calls in the hour leading up to the data marker.
The metric demo.trans.count is a cumulative counter metric, which means that it represents the total number of API calls since the start of the measurement. A cumulative counter metric can be used to measure the rate of change or the sum of events over a time period1 The chart below shows the metric demo.trans.count with a one-hour rollup and a line chart type. A rollup is a way to aggregate data points over a specified time interval, such as one hour, to reduce the number of data points displayed on a chart. A line chart type connects the data points with a line to show the trend of the metric over time2 Each data marker on the chart represents the sum of API calls in the hour leading up to the data marker. This is because the rollup function for cumulative counter metrics is sum by default, which means that it adds up all the data points in each time interval. For example, the data marker at 10:00 AM shows the sum of API calls from 9:00 AM to 10:00 AM3 To learn more about how to use metrics and charts in Splunk Observability Cloud, you can refer to these documentations123.
1: https://docs.splunk.com/Observability/gdi/metrics/metrics.html#Metric-types 2:
https://docs.splunk.com/Observability/gdi/metrics/charts.html#Data-resolution-and-rollups-in-charts 3:
https://docs.splunk.com/Observability/gdi/metrics/charts.html#Rollup-functions-for-metric-types
質問 # 45
Which of the following statements about adding properties to MTS are true? (select all that apply)
- A. Properties are sent in with datapoints.
- B. Properties can be set in the UI under Metric Metadata.
- C. Properties can be set via the API.
- D. Properties are applied to dimension key:value pairs and propagated to all MTS with that dimension
正解:B、C
解説:
Explanation
According to the web search results, properties are key-value pairs that you can assign to dimensions of existing metric time series (MTS) in Splunk Observability Cloud1. Properties provide additional context and information about the metrics, such as the environment, role, or owner of the dimension. For example, you can add the property use: QA to the host dimension of your metrics to indicate that the host that is sending the data is used for QA.
To add properties to MTS, you can use either the API or the UI. The API allows you to programmatically create, update, delete, and list properties for dimensions using HTTP requests2. The UI allows you to interactively create, edit, and delete properties for dimensions using the Metric Metadata page under Settings3.
Therefore, option A and D are correct.
質問 # 46
A customer operates a caching web proxy. They want to calculate the cache hit rate for their service. What is the best way to achieve this?
- A. Chart Options and metadata
- B. Timeshift and Bottom N
- C. Percentages and ratios
- D. Timeshift and Top N
正解:C
解説:
Explanation
According to the Splunk O11y Cloud Certified Metrics User Track document1, percentages and ratios are useful for calculating the proportion of one metric to another, such as cache hits to cache misses, or successful requests to failed requests. You can use the percentage() or ratio() functions in SignalFlow to compute these values and display them in charts. For example, to calculate the cache hit rate for a service, you can use the following SignalFlow code:
percentage(counters("cache.hits"), counters("cache.misses"))
This will return the percentage of cache hits out of the total number of cache attempts. You can also use the ratio() function to get the same result, but as a decimal value instead of a percentage.
ratio(counters("cache.hits"), counters("cache.misses"))
質問 # 47
A Software Engineer is troubleshooting an issue with memory utilization in their application. They released a new canary version to production and now want to determine if the average memory usage is lower for requests with the 'canary' version dimension. They've already opened the graph of memory utilization for their service.
How does the engineer see if the new release lowered average memory utilization?
- A. On the chart for plot A, scroll to the end and click Enter Function, then enter 'A/B-l'.
- B. On the chart for plot A, select Add Analytics, then select MeanrTransformation. In the window that appears, select 'version' from the Group By field.
- C. On the chart for plot A, click the Compare Means button. In the window that appears, type 'version1.
- D. On the chart for plot A, select Add Analytics, then select Mean:Aggregation. In the window that appears, select 'version' from the Group By field.
正解:D
解説:
Explanation
The correct answer is C. On the chart for plot A, select Add Analytics, then select Mean:Aggregation. In the window that appears, select 'version' from the Group By field.
This will create a new plot B that shows the average memory utilization for each version of the application.
The engineer can then compare the values of plot B for the 'canary' and 'stable' versions to see if there is a significant difference.
To learn more about how to use analytics functions in Splunk Observability Cloud, you can refer to this documentation1.
1: https://docs.splunk.com/Observability/gdi/metrics/analytics.html
質問 # 48
The Sum Aggregation option for analytic functions does which of the following?
- A. Calculates the sum of values per time series across a period of time.
- B. Calculates 1/2 of the values present in the input time series.
- C. Calculates the sum of values present in the input time series across the entire environment or per group.
- D. Calculates the number of MTS present in the plot.
正解:C
解説:
Explanation
According to the Splunk Test Blueprint - O11y Cloud Metrics User document1, one of the metrics concepts that is covered in the exam is analytic functions. Analytic functions are mathematical operations that can be applied to metrics to transform, aggregate, or analyze them.
The Splunk O11y Cloud Certified Metrics User Track document2 states that one of the recommended courses for preparing for the exam is Introduction to Splunk Infrastructure Monitoring, which covers the basics of metrics monitoring and visualization.
In the Introduction to Splunk Infrastructure Monitoring course, there is a section on Analytic Functions, which explains that analytic functions can be used to perform calculations on metrics, such as sum, average, min, max, count, etc. The document also provides examples of how to use analytic functions in charts and dashboards.
One of the analytic functions that can be used is Sum Aggregation, which calculates the sum of values present in the input time series across the entire environment or per group. The document gives an example of how to use Sum Aggregation to calculate the total CPU usage across all hosts in a group by using the following syntax:
sum(cpu.utilization) by hostgroup
質問 # 49
Which of the following can be configured when subscribing to a built-in detector?
- A. Links to a chart.
- B. Outbound notifications.
- C. Alerts on a dashboard.
- D. Alerts on team landing page.
正解:B
解説:
Explanation
According to the web search results1, subscribing to a built-in detector is a way to receive alerts and notifications from Splunk Observability Cloud when certain criteria are met. A built-in detector is a detector that is automatically created and configured by Splunk Observability Cloud based on the data from your integrations, such as AWS, Kubernetes, or OpenTelemetry1. To subscribe to a built-in detector, you need to do the following steps:
Find the built-in detector that you want to subscribe to. You can use the metric finder or the dashboard groups to locate the built-in detectors that are relevant to your data sources1.
Hover over the built-in detector and click the Subscribe button. This will open a dialog box where you can configure your subscription settings1.
Choose an outbound notification channel from the drop-down menu. This is where you can specify how you want to receive the alert notifications from the built-in detector. You can choose from various channels, such as email, Slack, PagerDuty, webhook, and so on2. You can also create a new notification channel by clicking the + icon2.
Enter the notification details for the selected channel. This may include your email address, Slack channel name, PagerDuty service key, webhook URL, and so on2. You can also customize the notification message with variables and markdown formatting2.
Click Save. This will subscribe you to the built-in detector and send you alert notifications through the chosen channel when the detector triggers or clears an alert.
Therefore, option C is correct.
質問 # 50
......
SPLK-4001サンプルには正確な更新された問題がこちら:https://www.goshiken.com/Splunk/SPLK-4001-mondaishu.html