

合格させるTDS-C01日本語テスト問題集で[2026年09月12日]に更新された138問あります
Tableau TDS-C01日本語実際の問題と100%カバー率でリアル試験問題
質問 # 15
視覚化において軸を作成するには、何を使用すればよいですか?
- A. 次元
- B. フィルター
- C. 測定
- D. パラメータ
正解:C
解説:
To create an axis in a Tableau visualization, you need a measure. When you add a measure to the Rows or Columns shelf, Tableau generates an axis to display the range of values for that measure. Dimensions, parameters, and filters do not create axes; they are used for categorizing data, setting controls, or limiting data, respectively.
質問 # 16
CoffeeChain テーブルを使用して、各製品タイプの売上 (棒グラフ) と利益 (折れ線グラフ) を示す二重軸グラフを作成します。2013 年のハーブティー製品タイプの利益は?
- A. 74,683
- B. 46,493
- C. 37,455
- D. 68,620
正解:C
解説:
If you answered this question quickly and correctly, you're well prepared for the exam! Most students stumble while creating a Dual axis chart, so go ahead and give yourself a pat on the back!
To create a dual axis chart for the problem mentioned:
1) Drag Product Type to the column shelf, and Sales and Profit to the Row shelf:
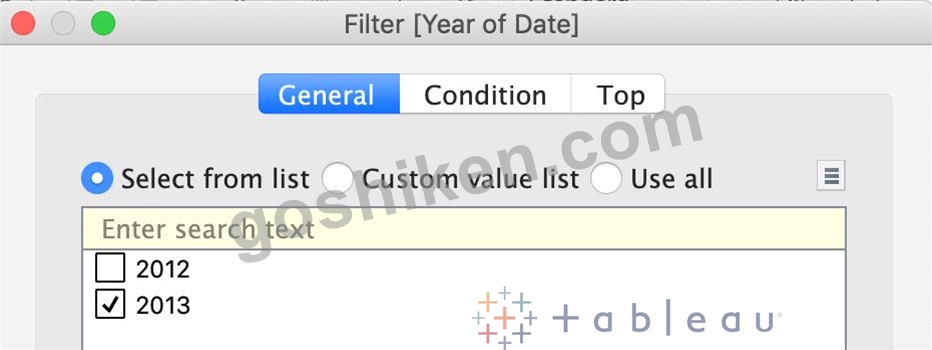
2) Now, to focus on 2013, drag Date to the filter shelf and select only 2013: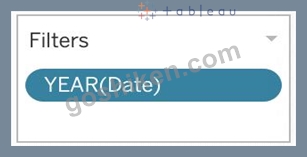
3) Now, click on the Profit pill in the Rows Shelf, and select dual axis: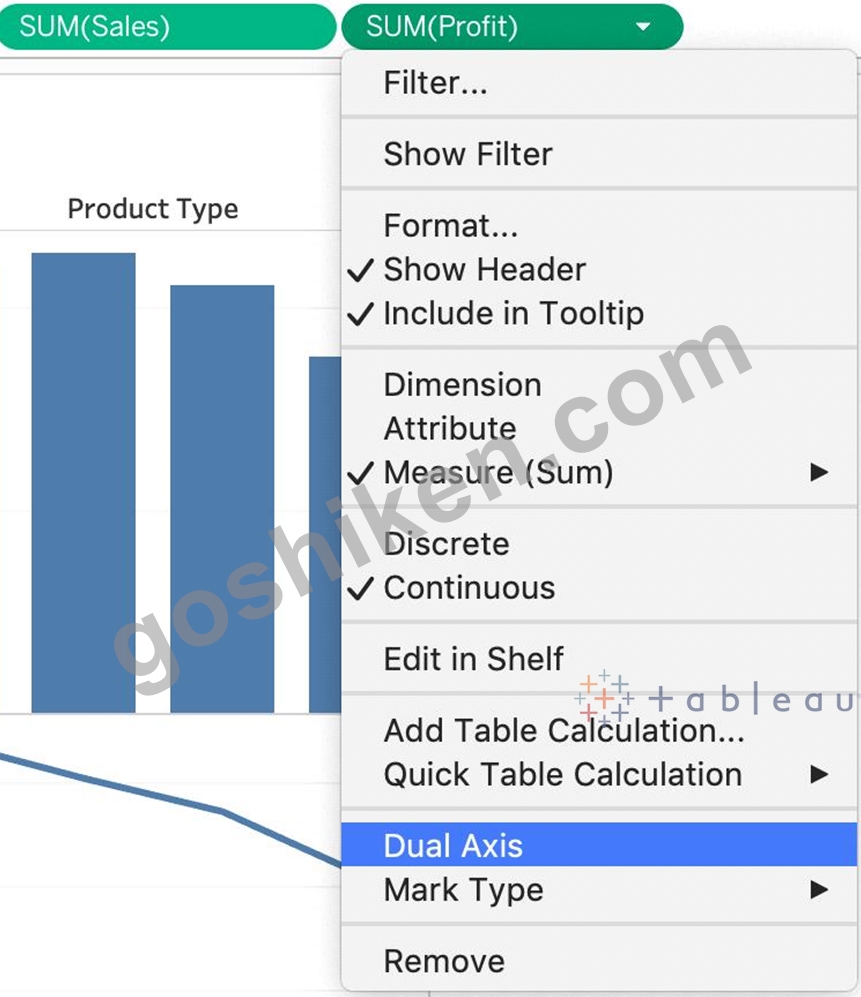
4) Now, in the marks shelf, choose Sales, and change the chart type to bar. Similarly, for Profit, change the chart type to Line.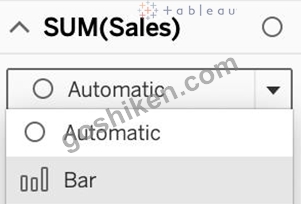
Now the chart looks like this: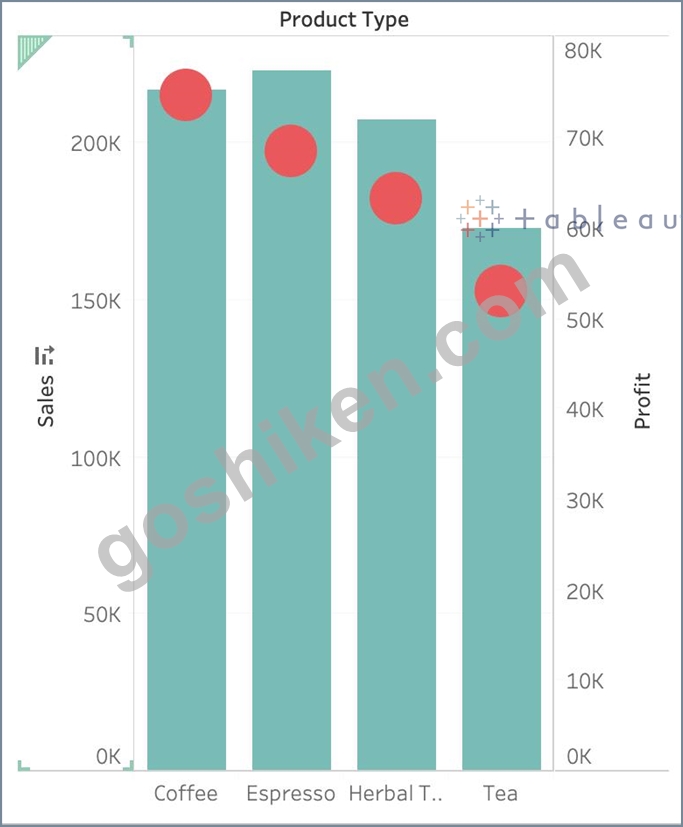
Now we change the Profit chart type to line: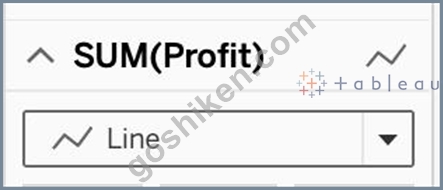
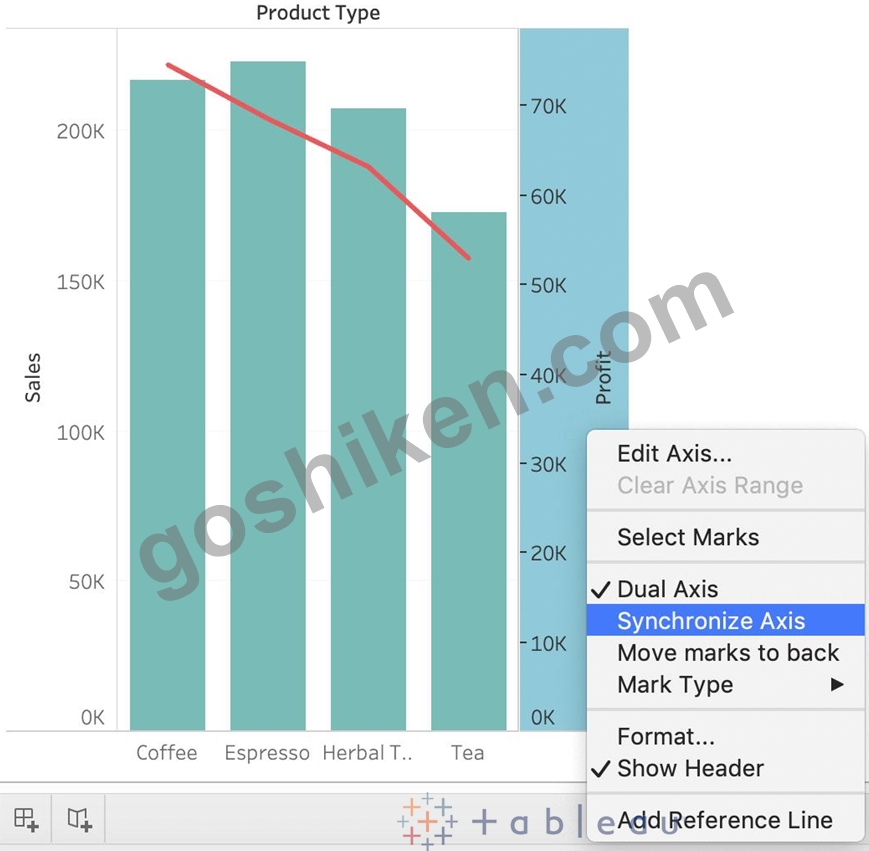
5) Finally, we synchronise the axis as follows: Right click on the axis, and choose 'Synchronise axis'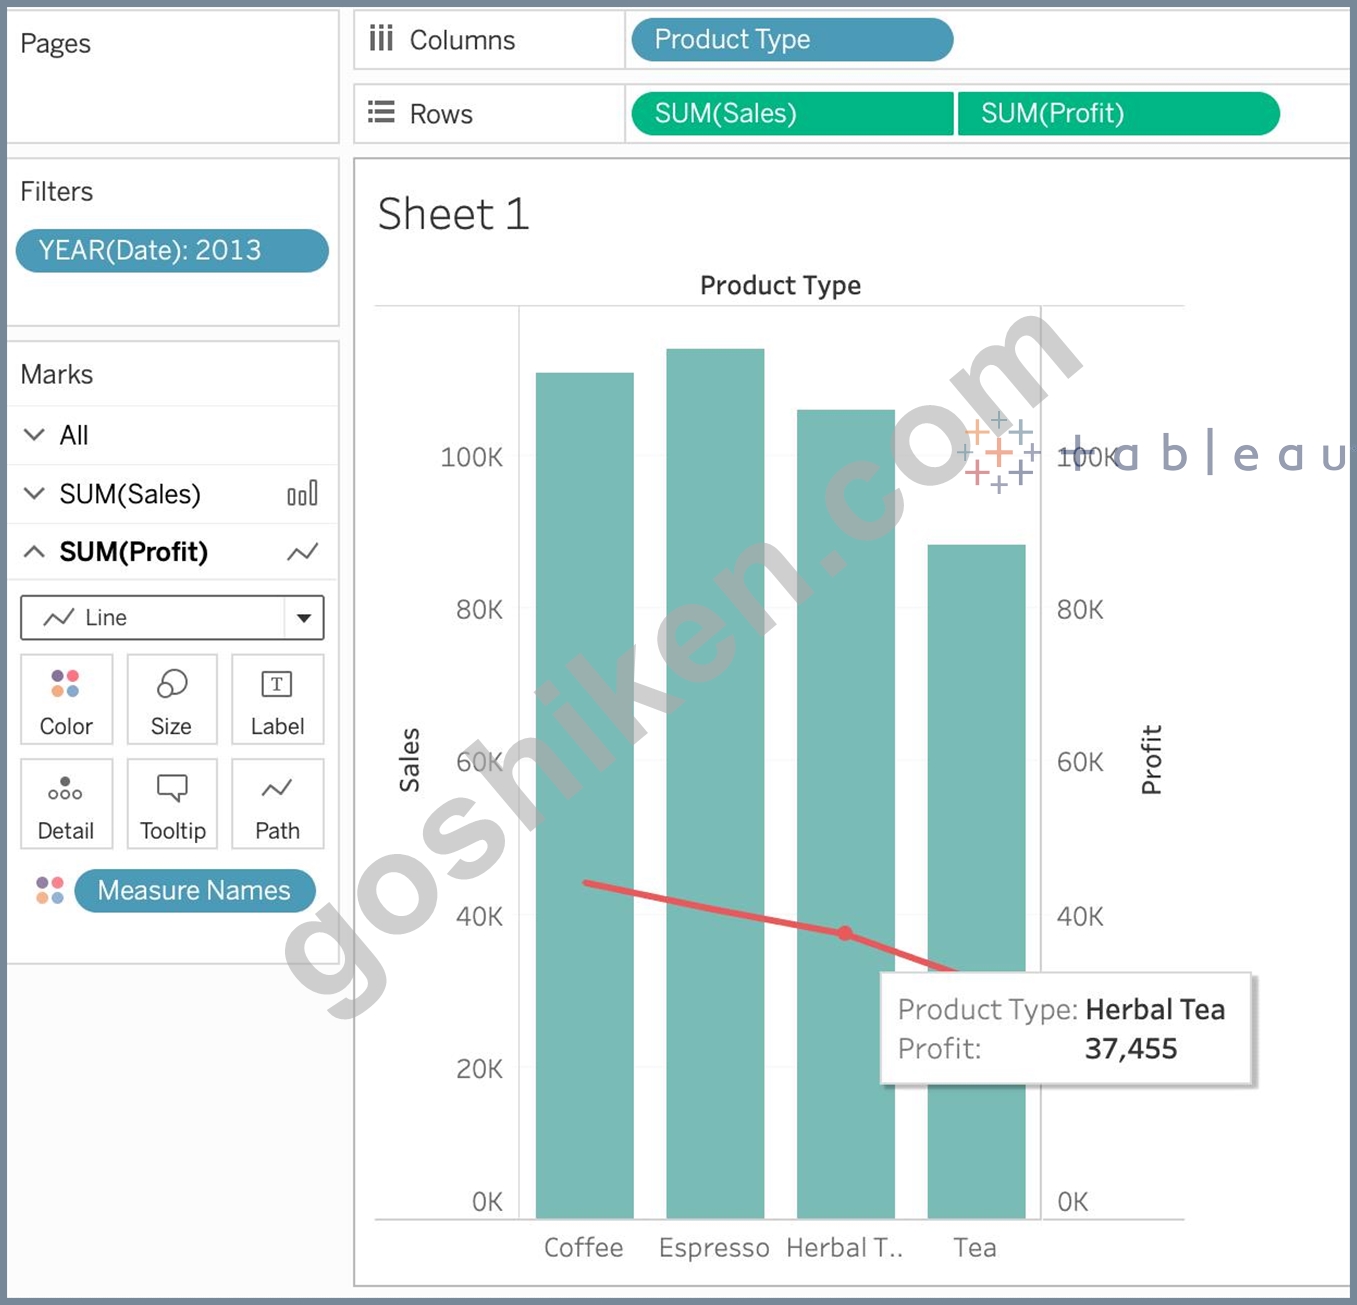
And, our final view and answer is:
質問 # 17
寸法のカラーパレットを変更するには、オプションにアクセスする必要があります。
マークスカード以外に何が使えますか?
- A. フォーマットメニュー
- B. シェルフ内で編集
- C. キャプションの編集
- D. 色の凡例
正解:D
解説:
You can use the Color legend to access options to change a dimension's color palette, in addition to the Marks card. The Color legend shows the colors assigned to each member of the dimension in the view. You can right-click on the Color legend and select Edit Colors to open the Edit Colors dialog box, where you can change the color palette, assign specific colors to dimension members, or edit the color transparency and border6 The other options are not valid ways to change a dimension's color palette. Edit in Shelf is a feature that allows you to edit the fields on the Rows or Columns shelves by typing directly on the shelf. It does not affect the color palette of the dimension7 The Format menu allows you to change the appearance of various elements in the workbook, such as fonts, borders, shading, alignment, etc. It does not have options for changing the color palette of the dimension8 Edit Caption is a feature that allows you to add or edit a caption for a worksheet or dashboard. It does not affect the color palette of the dimension
質問 # 18
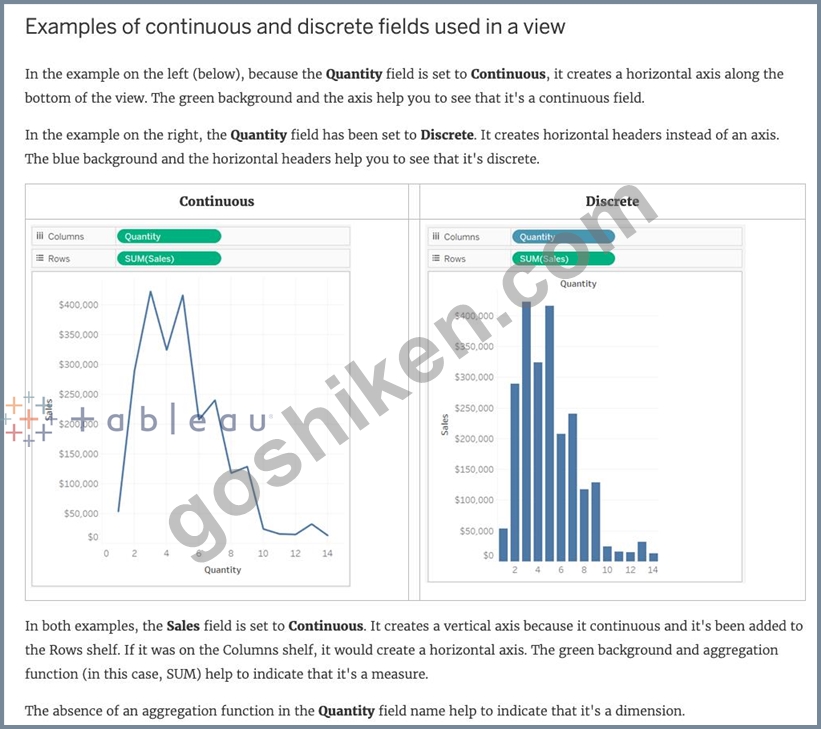
Tableau では、青と緑の色は何を表していますか?
- A. 連続および離散
- B. 離散および連続
- C. 寸法とメジャー
- D. メジャーとディメンション
正解:B
解説:
Important question! If you selected Dimension and Measure, don't worry! It is a very common mistake. But we're here to learn aren't we?
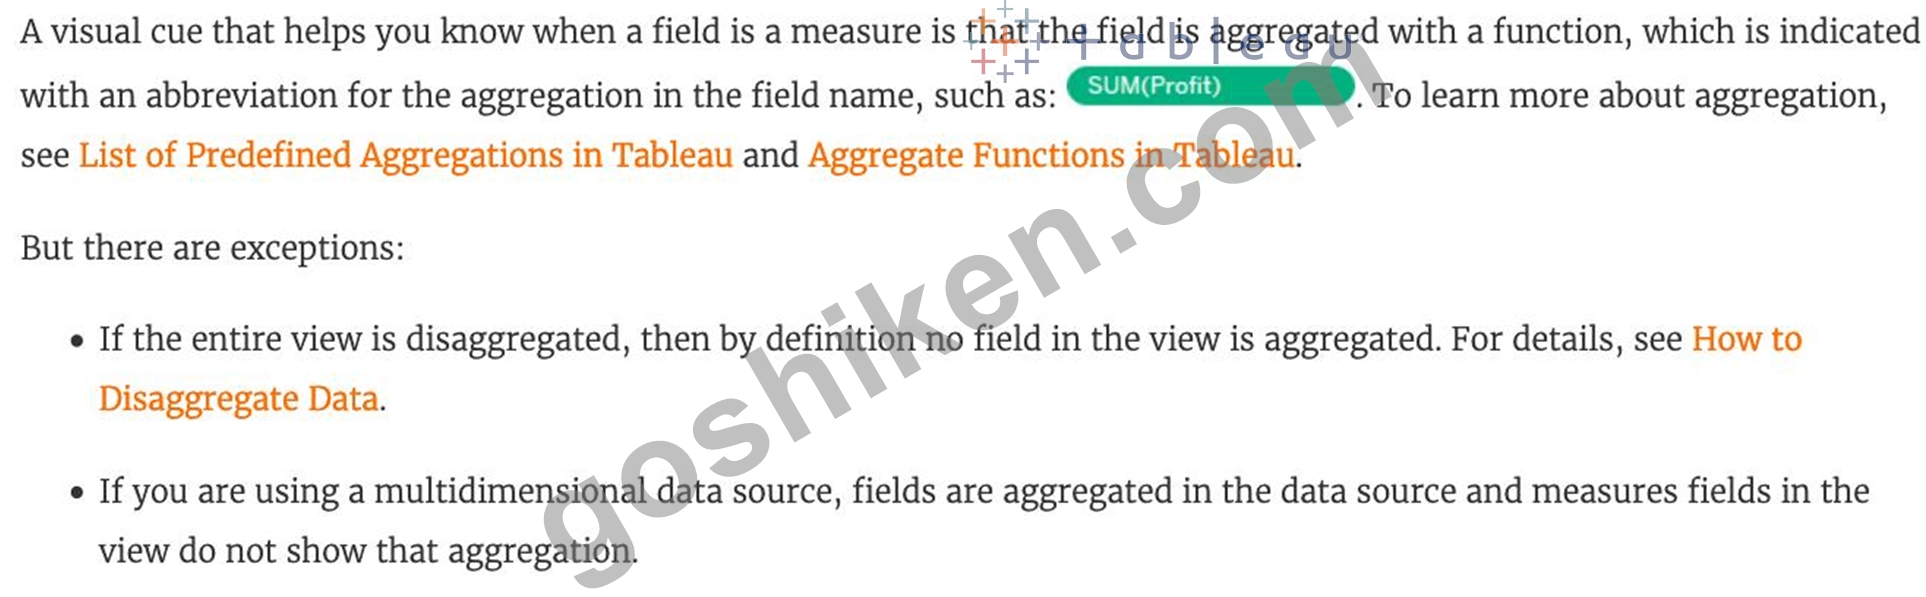
When you connect to a new data source, Tableau assigns each field in the data source as dimension or measure in the Data pane, depending on the type of data the field contains. You use these fields to build views of your data.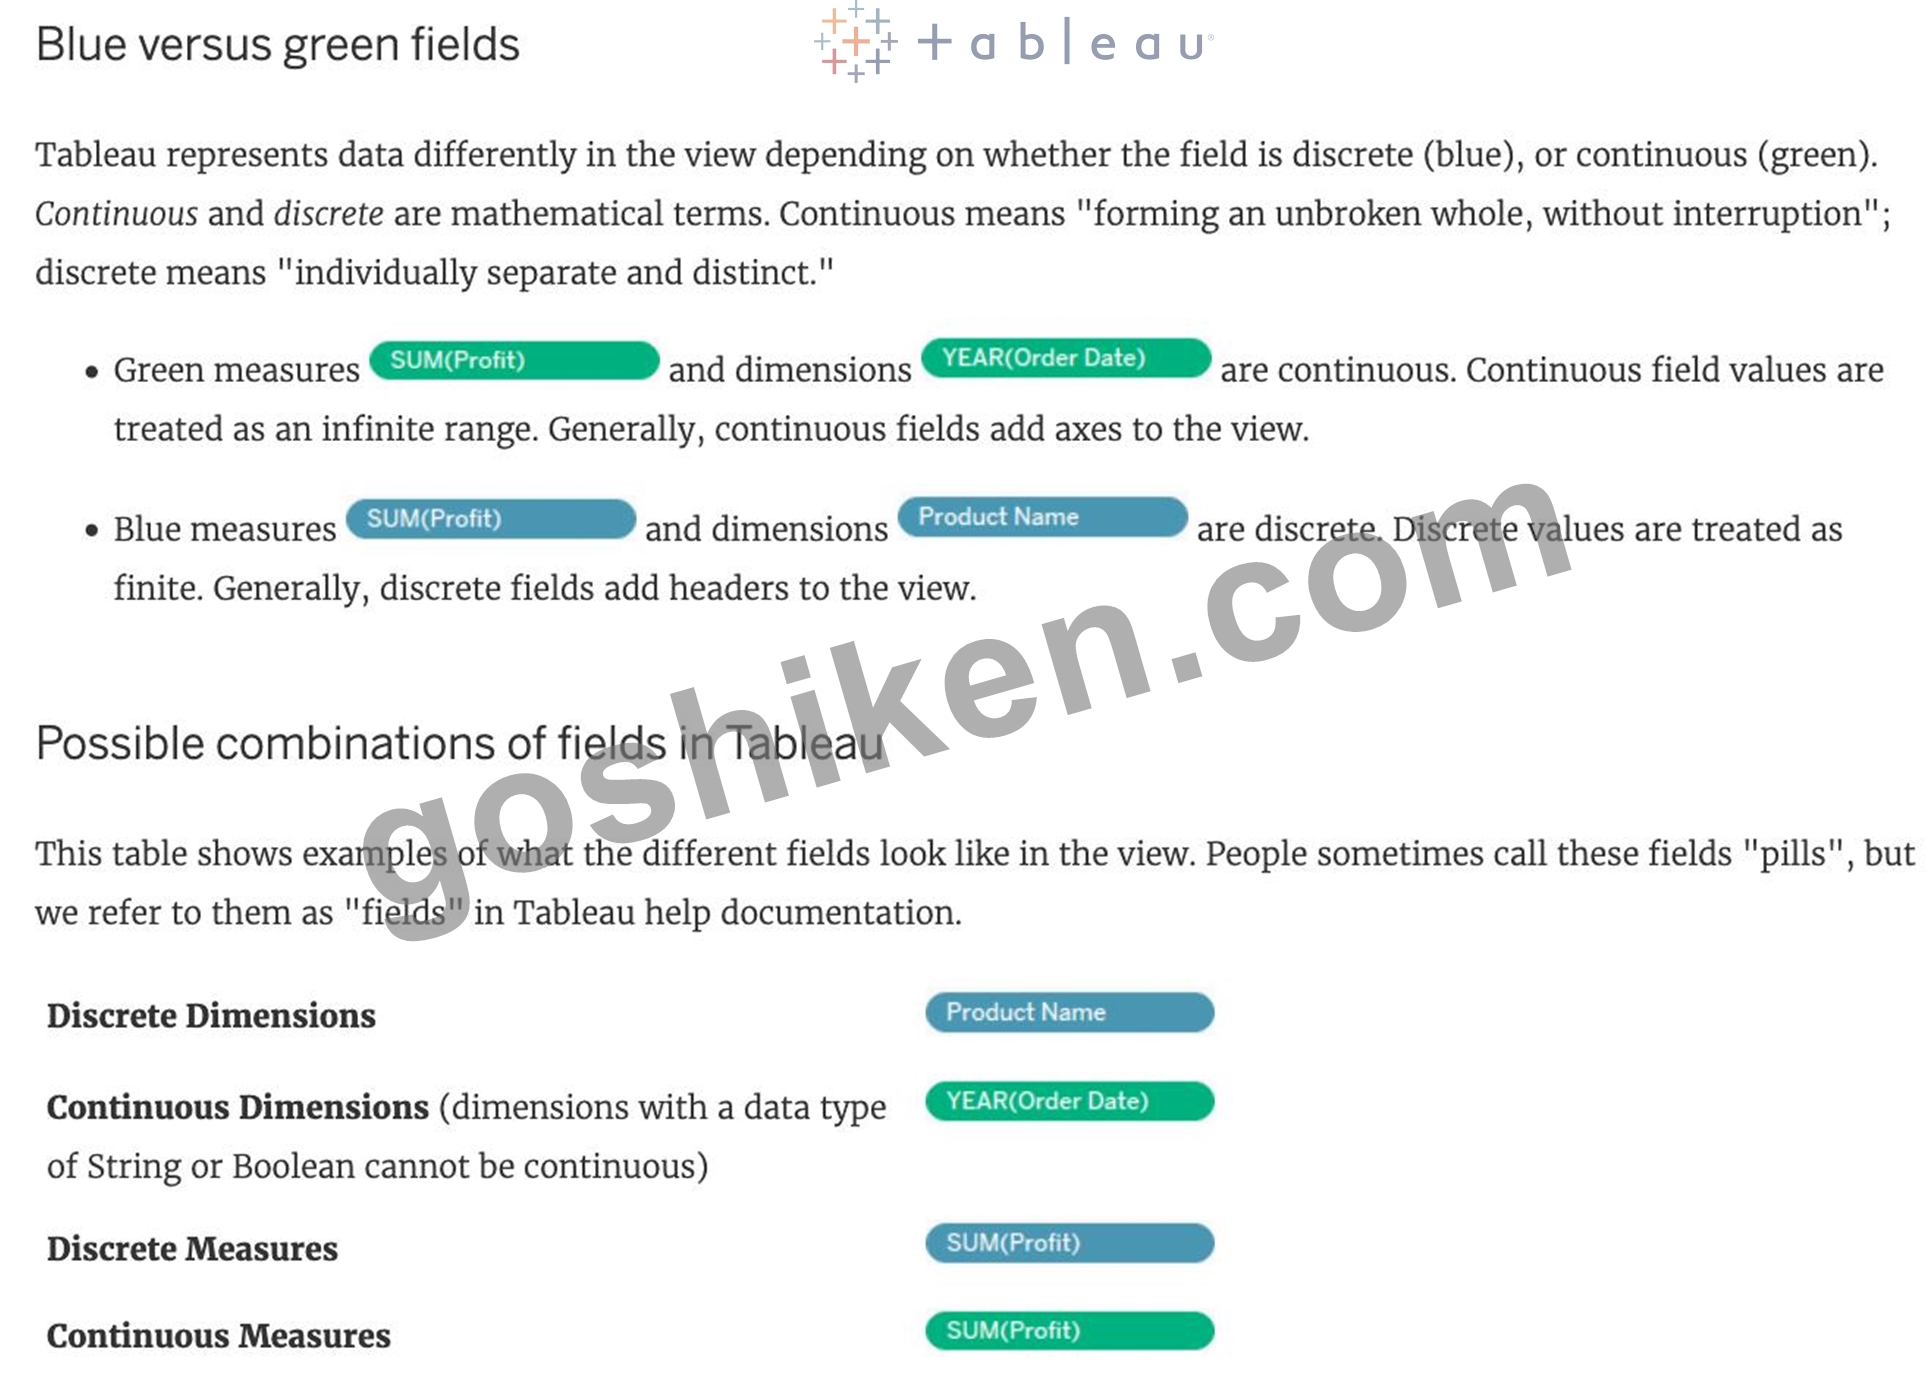
質問 # 19
次のアイコンは Tableau で何をしますか?
拡大画像
- A. ワークシートを作成する
- B. ストーリーとダッシュボードの両方を作成する
- C. ストーリーを作成する
- D. ダッシュボードを作成する
正解:D
解説:
The icon shown is used to add a new Dashboard! From the official documentation: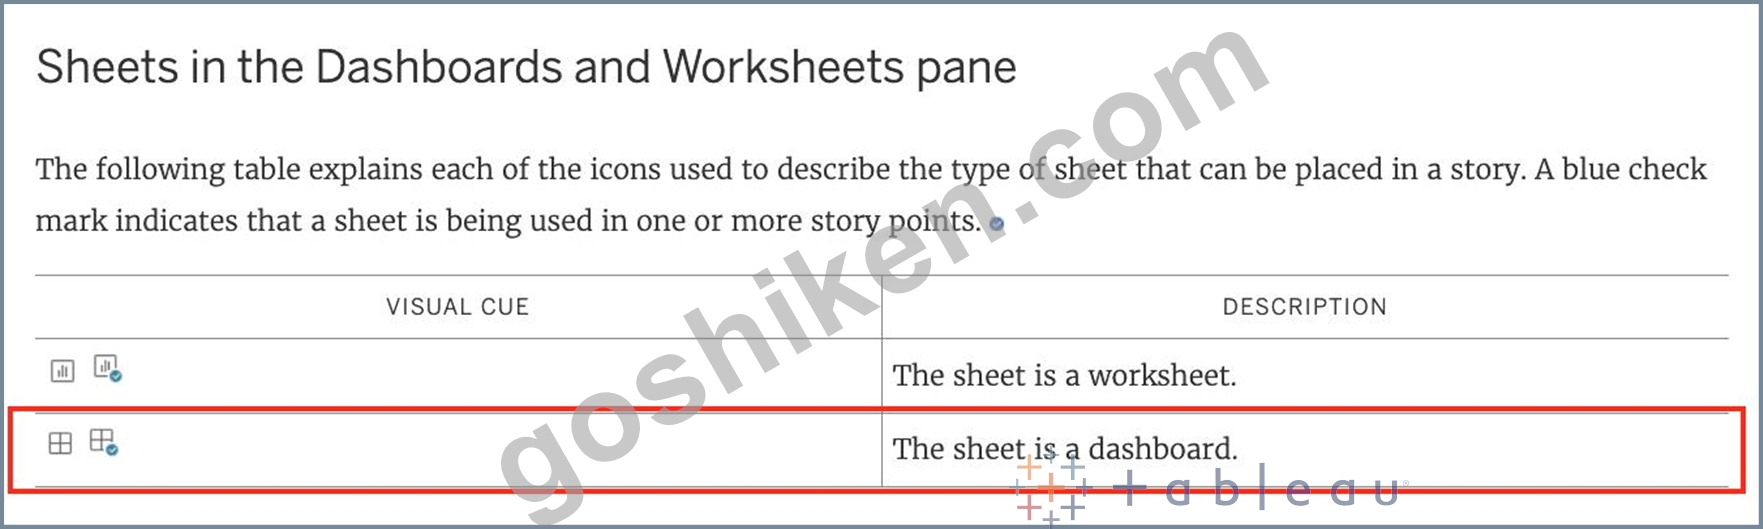
質問 # 20
正誤問題: 物理テーブルは個別 (正規化) のままであり、データ ソースにマージされませんが、論理テーブルは単一のフラット テーブルにマージされます。
- A. 真
- B. 偽
正解:B
解説:
In fact, the opposite of this is true.
Trick : Whenever you think of joins -> Think that after the join is created, we get 1 single flat combined (joined) table. This flat combined table is created prior to us creating our visualizations. This happens at the physical layer.
If you ever think about relationships, know that all tables will remain distinct and separate, and relationships sit at the logical layer. At run time, when you bring in the dimensions and measures to create your viz, Tableau very smartly creates the necessary joins, relates the tables and sends queries to these tables to get the resultant data back in the most meaningful way possible. This allows you to focus on using your data and revealing insights from it and focus less on the data preparation aspect!
Refer to logical layer vs physical layer from the official documentation: https://help.tableau.com/current/server/en-us/datasource_datamodel.htm
質問 # 21
ビュー/ビジュアライゼーションの構築に使用されるデータをエクスポートするオプションは次のうちどれですか?
- A. PDFファイル
- B. CSVファイル
- C. MS Access データベース
- D. JSON形式
正解:C
解説:
You can export the data in a Tableau data source, including all or part of the records from your original data. Alternatively, you can export only the portion of data used to generate the view.
Since the question mentions the data used to build the view, we'll focus on that :
*Export data in the view to Microsoft Access or .csv*
Export the data that is used to generate the view as an Access database (Windows only) or .csv file (Mac only).
1) In Tableau Desktop, select Worksheet > Export > Data.
2) Select a location and type a name for your Access database or .csv file.
3) Click Save.
4) If you're on Windows, the Export Data to Access dialog box displays to give you the option to immediately use the new Access database and continue working in Access without interrupting your work flow.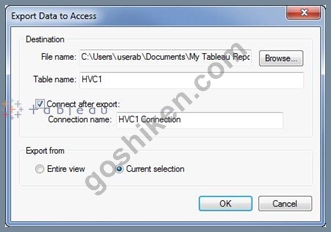
質問 # 22
不連続な日付部分は次のうちどれですか?
- A. 20Sep2016:9:8:8:6546
- B. 07Mar20l7
- C. 01/23/2021
- D. February
正解:D
解説:
February is a discrete date part, because it is a specific value that can be used to group or filter data by month. 07Mar2017, 20Sep2016:9:8:8:6546, and 01/23/2021 are continuous date values, because they represent points along a continuous timeline that can be used for analysis.
質問 # 23
次のうち、関連するダッシュボード アイテムをグループ化してすばやく配置できるのはどれですか?
- A. レイアウト コンテナー
- B. レイアウト拡張
- C. レイアウトブランク
- D. レイアウト ポジショナー
正解:A
解説:
Layout containers let you group related dashboard items together so you can quickly position them. As you change the size and placement of items inside a container, other container items automatically adjust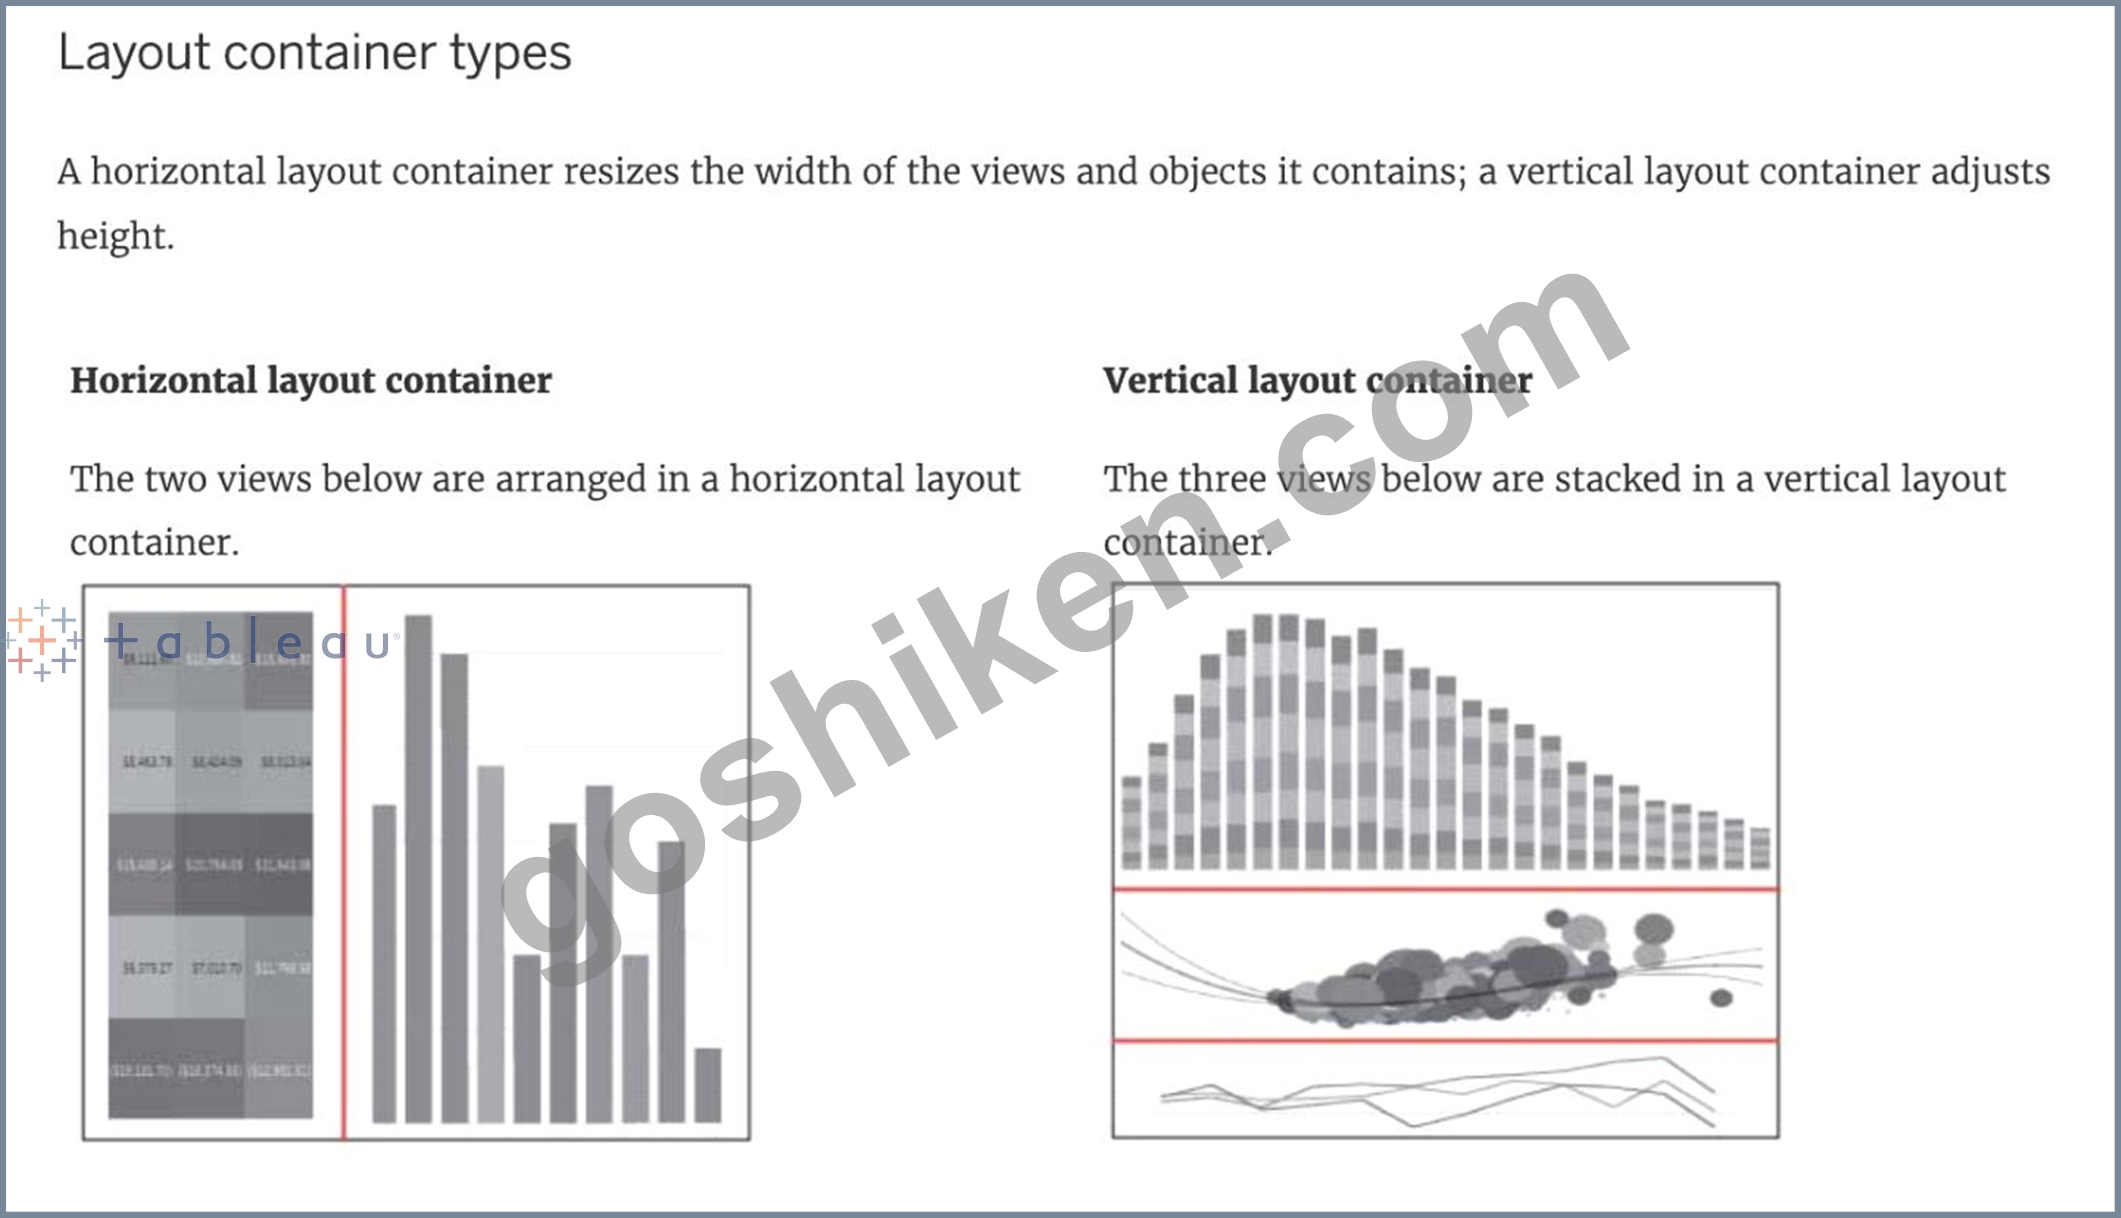
質問 # 24
売上高が 30,000 を超える顧客名を含むセットを作成します。このセットで最も売り上げが少なかった顧客は?
- A. ペネロペ・セウォール
- B. サンジット・エングル
- C. トム・アッシュブルック
- D. タマラ・チャンド
正解:A
解説:
As the question mentions, we need to create a SET with the following conditions -> Choose only those customers whose Sales > 30,000
1) Right click on customer name --> Create --> Set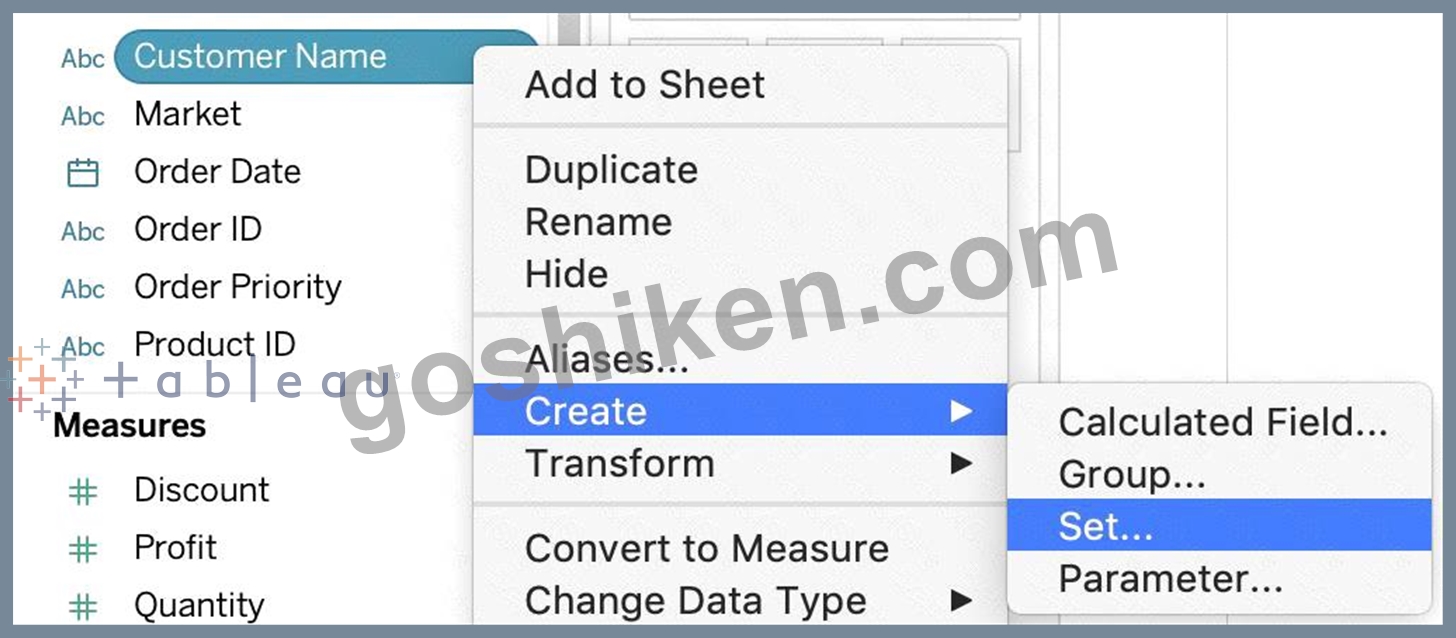
2) Let's Name the Set - Customer>30k ( you can name it anything you want :) ) Select USE ALL, and then move to the CONDITION TAB: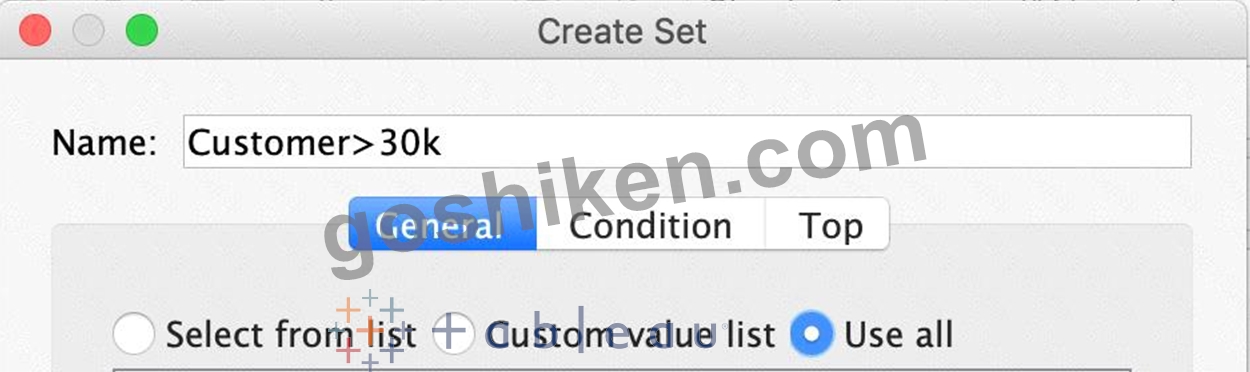
3) In the Condition Tab, Choose BY FIELD -> Select Sales -> Sum -> Greater than 30000 , and click OK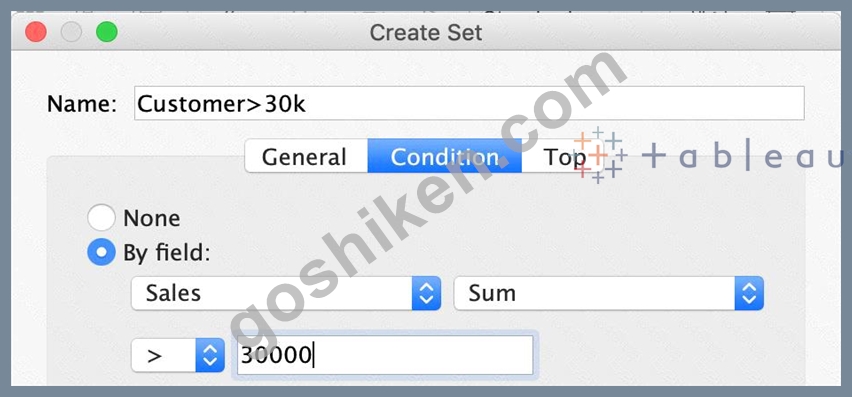
4) You should now have a new Set in the Data Pane as follows: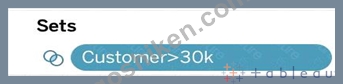
5) Drag this set to the rows shelf, and click on SHOW MEMBERS IN SET. Now drag Sales to the Column Shelf.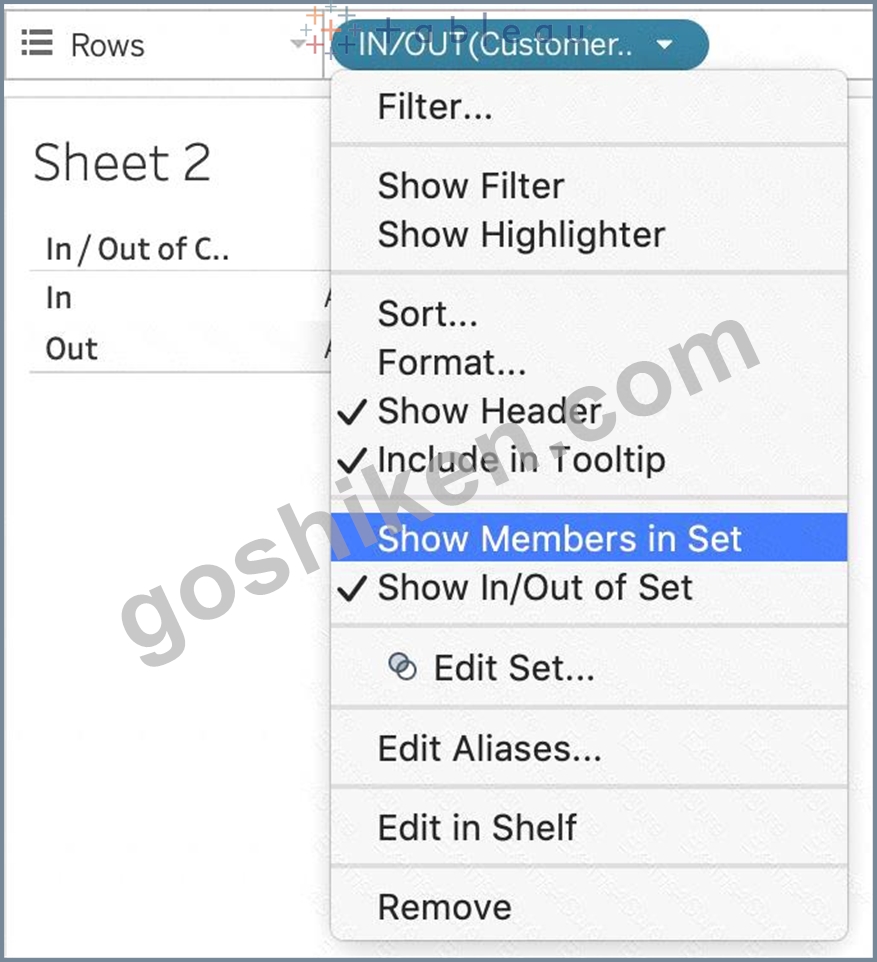
6) Click on the Show Mark Labels, and Sort ascending icons as shown: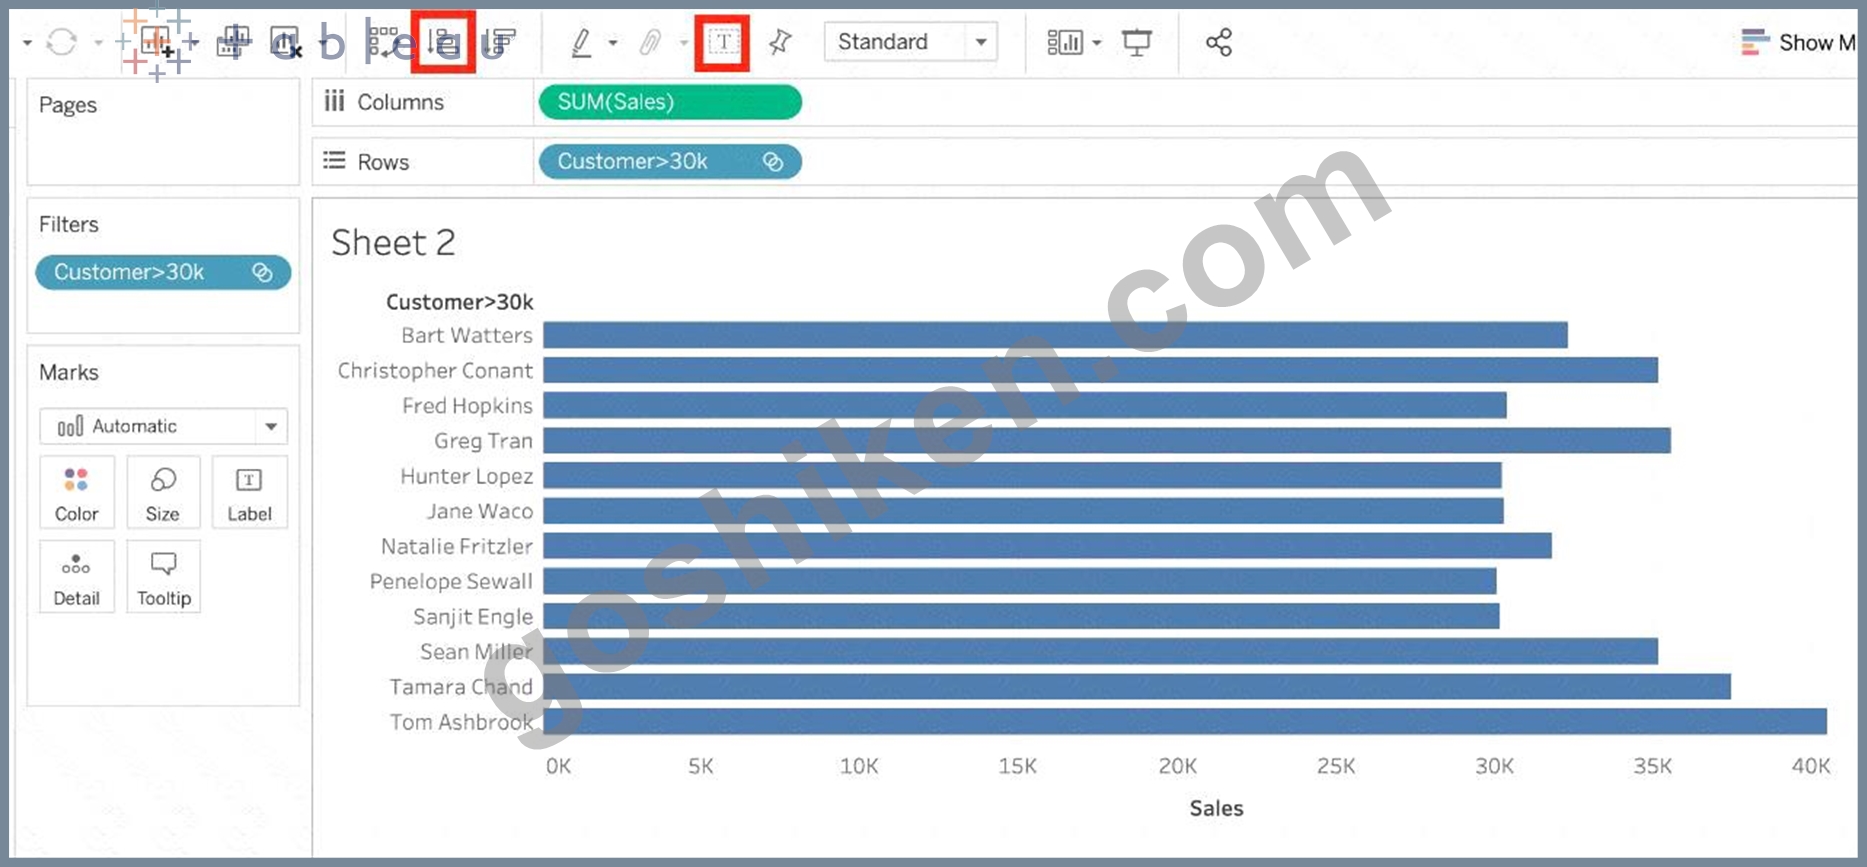
7) Voila! We have our answer:
c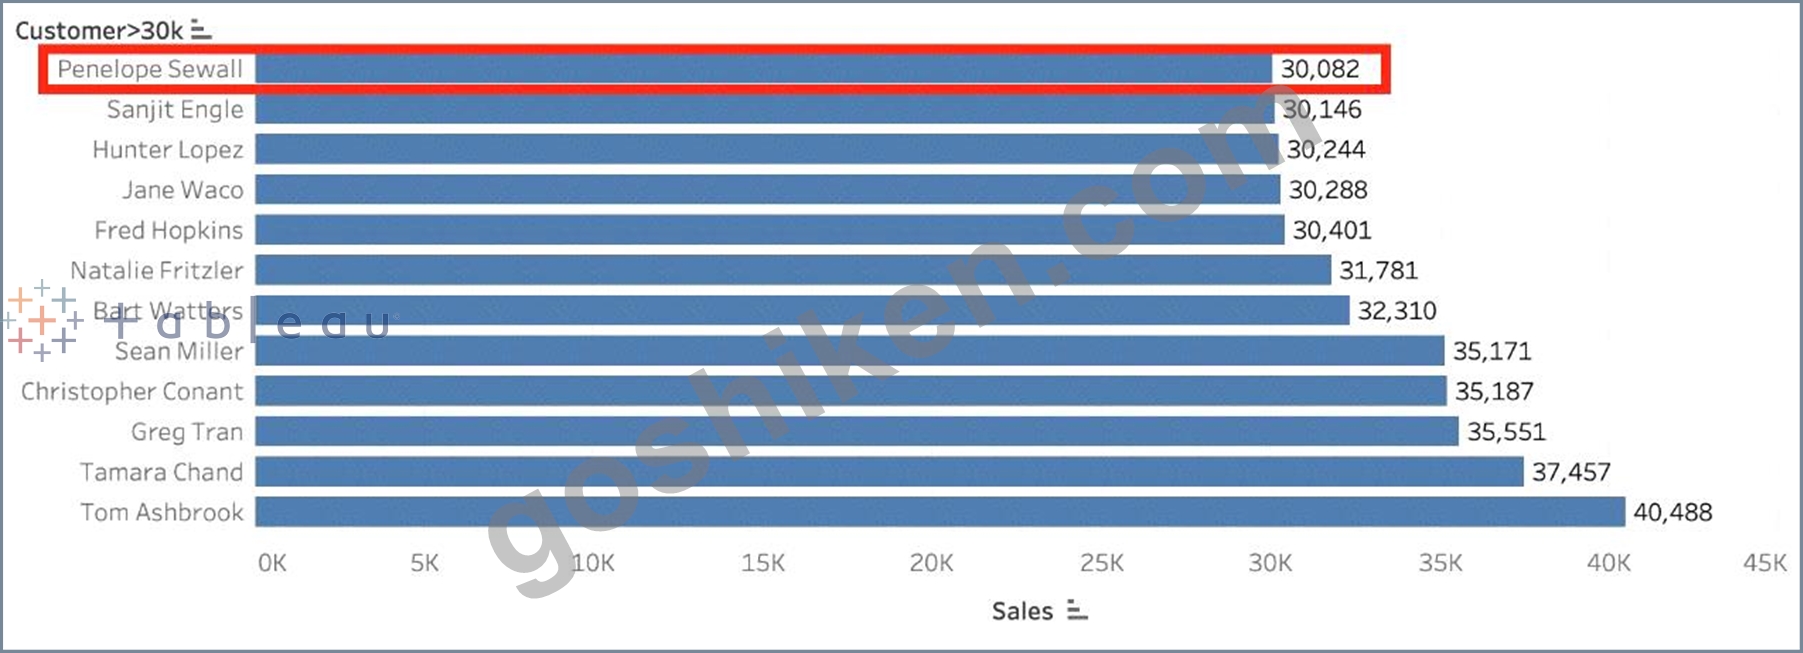
質問 # 25
______________ を静的ツールとして使用して、Tableau Desktop で作成された抽出データ ソースを含むパッケージ化されたワークブックを開いて操作できます。
- A. Tableau Reader
- B. Tableau Server
- C. Tableau Online
- D. Tableau デスクトップ
正解:A
解説:
The word 'static tool' gives it away.
According to the official website :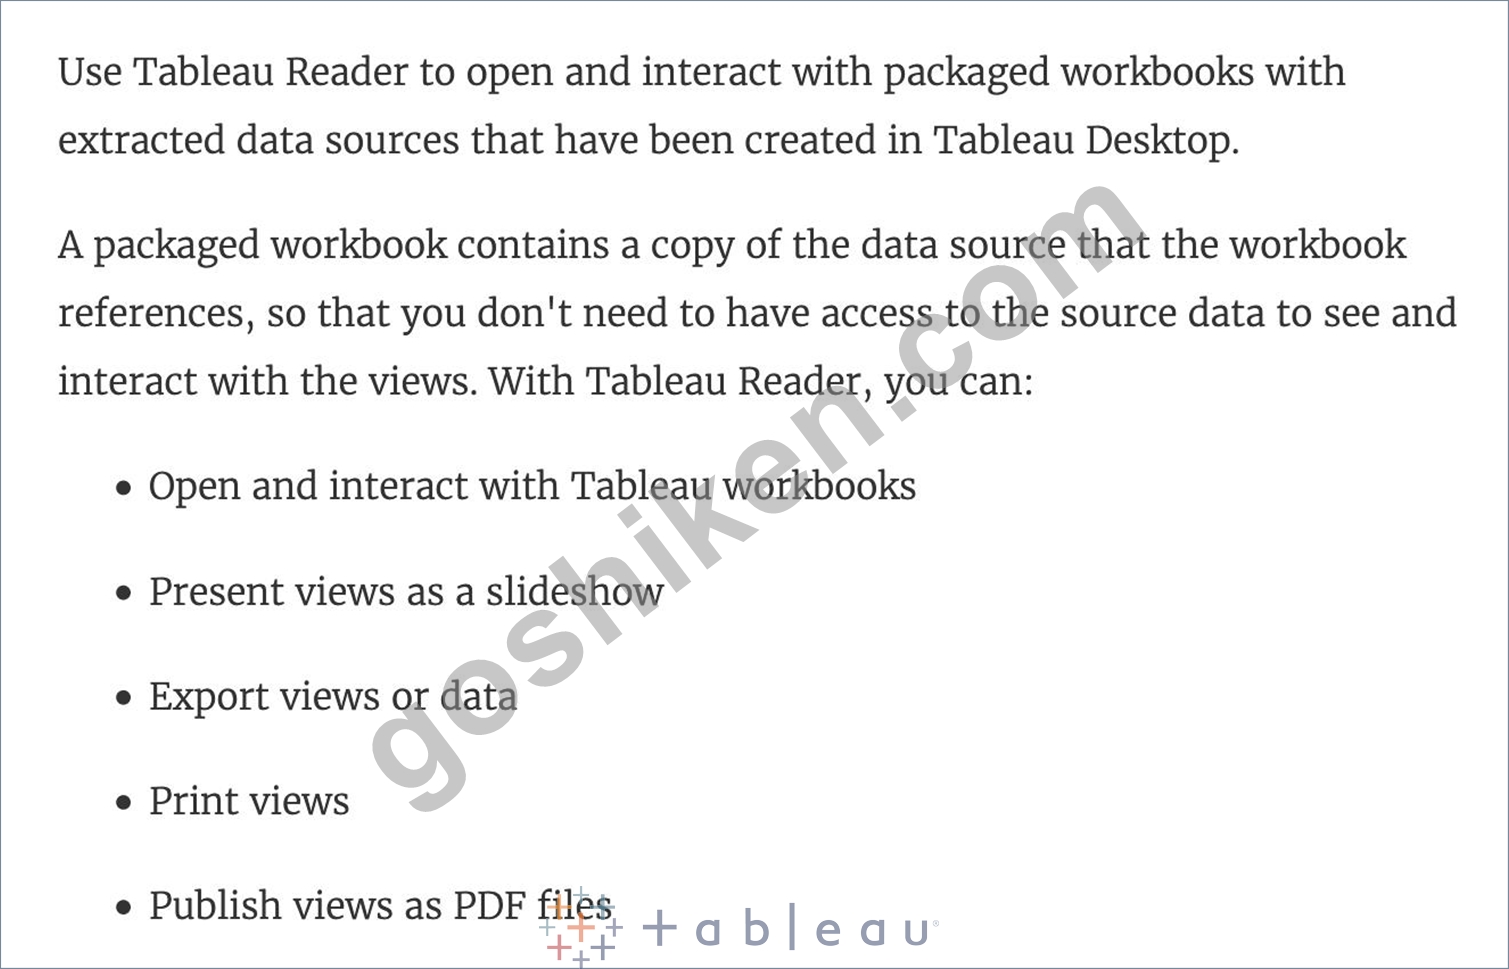
質問 # 26
どのタイプのフィールドでビンを作成するオプションが利用できますか?
- A. 日付
- B. 弦
- C. 数値
- D. ブール値
正解:C
質問 # 27
2016 年の米国の平均住宅価格を示すフィールドは、次の可能性が最も高いです。
- A. 連続する日付値ディメンション
- B. 集計メジャー
- C. 個別の日付部分ディメンション
- D. 地理的次元
正解:B
解説:
This question is directly from the Official Tableau Desktop Specialist exam guide.
Since we are talking about the AVERAGE home values for the United States in 2016, the question is directly offering us a hint that the answer has something to do with aggregation and that too the values tell us that we're working with MEASURES.
Date part and Date values don't really make much sense given the question, and neither does geography.
Therefore, the answer naturally is "An aggregated measure".
質問 # 28
新しいデータ ソースに接続すると、以前は元のデータ ソースを参照していたすべてのワークシートが新しいデータ ソースを参照するようになりました。新しいデータ ソースに元のワークブックと同じフィールド名がない場合、フィールドは感嘆符でマークされます。
. この問題の解決に役立つ機能はどれですか?
- A. メタデータを修正
- B. 参照を置換
- C. 名前の変更
- D. エイリアス
正解:B
解説:
Replace References:
For example, say you have a workbook connected to a data source that contains a Customer Name field. Then you edit the data source to point to a new data source that has all the same data but instead of Customer Name, the field name has been changed to Name. The Customer Name field remains in the Data pane but is marked as invalid. To make the field valid, you can replace the references, which means you can map the invalid field to a valid field in the new data source (for example, Customer Name corresponds to Name).
Read more at : https://help.tableau.com/current/pro/desktop/en-us/howto_connect.htm
質問 # 29
Tableau のストーリー ポイントとは何ですか?
- A. 単一のワークシートまたはダッシュボード
- B. ワークシートとダッシュボードの両方のコレクション
- C. ワークシートの集まり
- D. ダッシュボードのコレクション
正解:A
解説:
In Tableau, a story is a sequence of visualizations that work together to convey information. You can create stories to tell a data narrative, provide context, demonstrate how decisions relate to outcomes, or to simply make a compelling case.
A story is a sheet, so the methods you use to create, name, and manage worksheets and dashboards also apply to stories (for more details, see Workbooks and Sheets). At the same time, a story is also a collection of sheets, arranged in a sequence. Each individual sheet (worksheet or dashboard) in a story is called a story point.
When you share a story -for example, by publishing a workbook to Tableau Public, Tableau Server, or Tableau Online-users can interact with the story to reveal new findings or ask new questions of the data.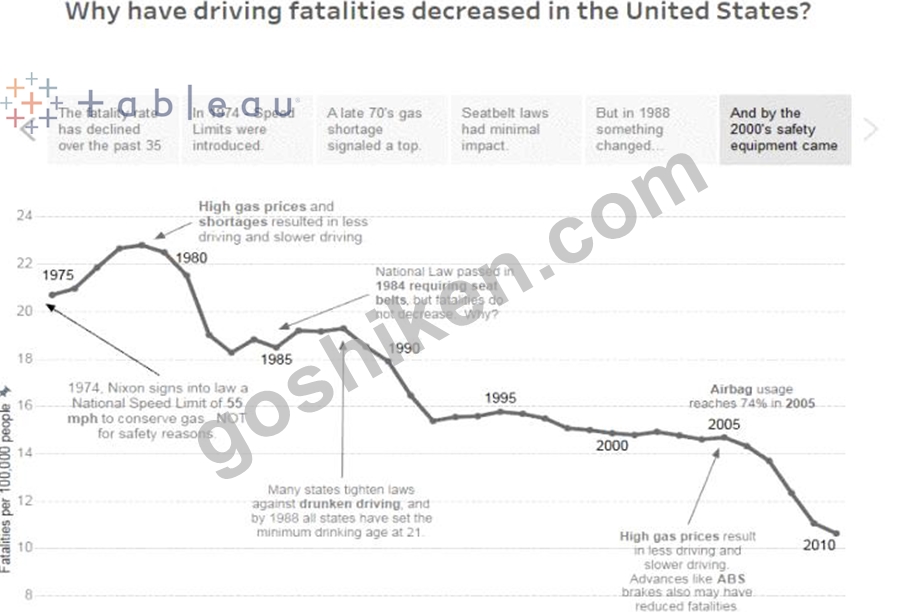
質問 # 30
次の状況のうち、ユニオンを使用する最適な理由はどれですか?
- A. 異なる形式で保存された 2 つのデータ セットがあり、それらを 1 つの形式に統合したいと考えています。
- B. 同じ名前のデータ列を持つ 2 つのテーブルがあり、それらを結合したいと考えています。
- C. 異なる名前のデータ列を持つ 2 つのテーブルがあり、それらを結合したいと考えています。
- D. 異なる値のみを検索したい、同様のデータ型を持つ 2 つのデータ セットがあります。
正解:B
解説:
You should use a union when you have two tables with similarly named columns of data that you want to combine. A union is a method for combining data by appending rows of one table onto another table. The tables that you union must have the same number of fields, the same field names, and the same data types2
質問 # 31
......
Tableau TDS-C01日本語リアルな2026年最新のブレーン問題集で模擬試験問題集:https://www.goshiken.com/Tableau/TDS-C01-JPN-mondaishu.html