

Tableau TDS-C01日本語試験情報と無料練習テストはこちら
合格させるTableau TDS-C01日本語プレミアムお試しセットテストエンジンPDFで無料問題集セット
質問 # 19
関係は __________________ で表され、____________________ で動作します。
- A. 麺、物理層
- B. ヌードル、論理レイヤー
- C. ベン図、物理層
- D. ベン図、論理層
正解:B
解説:
From the official documentation:
The default view that you first see in the Data Source page canvas is the logical layer of the data source. You combine data in the logical layer using relationships (or noodles).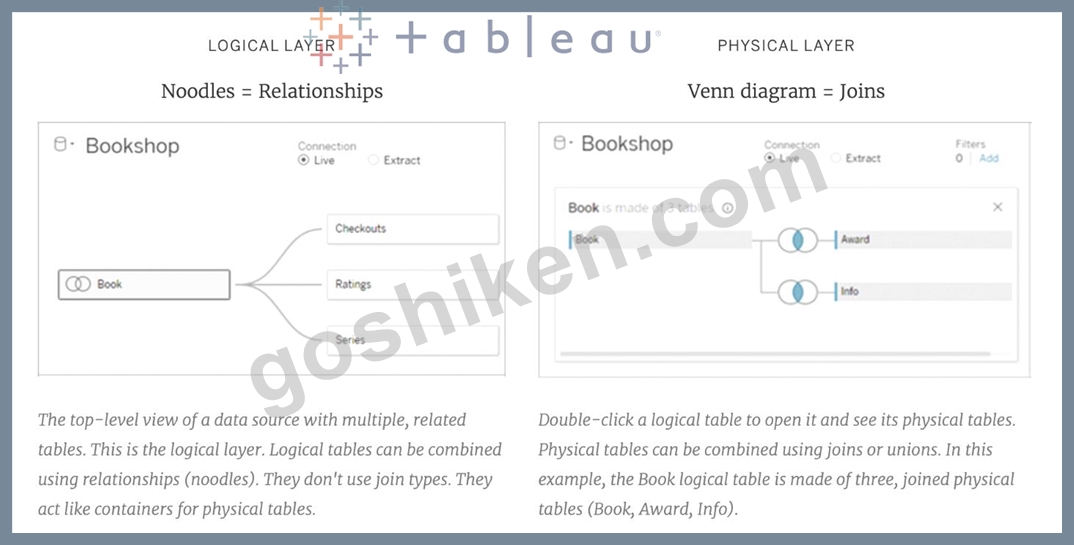
質問 # 20
____________ 並べ替えの場合、データがどのように変化しても、値は常に保持した並べ替え順序のままになります。
- A. ランダム
- B. マニュアル
- C. トポロジカル
- D. 階層
正解:B
解説:
For a manual sort, no matter how the data changes, the values will always stay in the sort order you kept stuff in.
From the official website: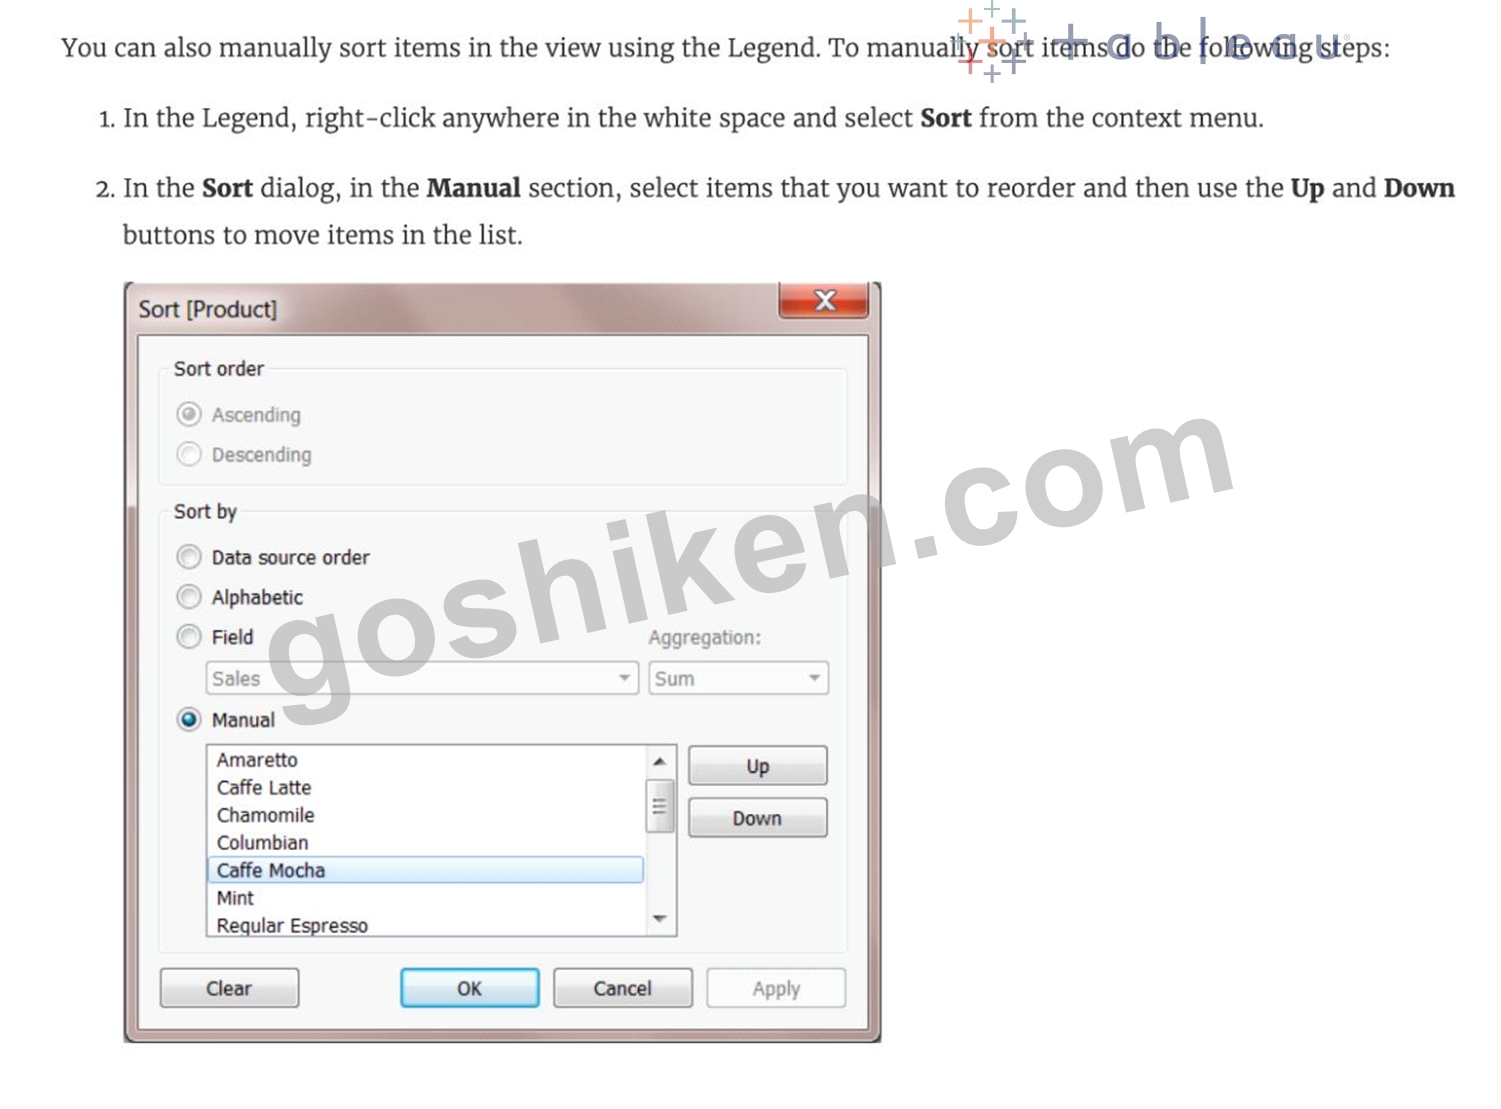
質問 # 21
次のうち、Tableau Desktop の有効な公式データ ソースでないものはどれですか?
- A. PostgreSQL
- B. Google Firebase
- C. Amazon Redshift
- D. SAP HANA
正解:C
解説:
Presently, there is no official way to connect your data in Firebase directly with Tableau Desktop.
A workaround however can be to export your Firebase data into Google BigQuery, and then connect it to Tableau Desktop.
But then again, it is a workaround and not an official out-of-the-box solution.
The following are the available Data sources available as of now:
Server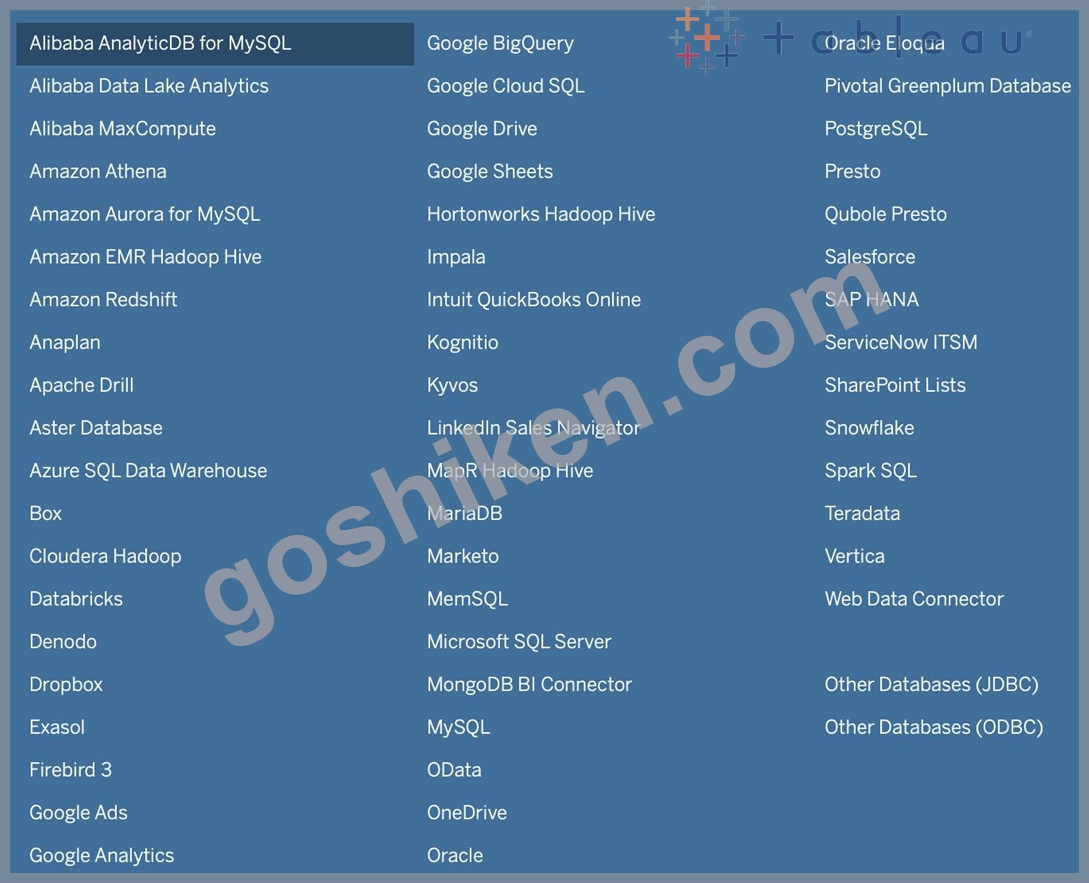
File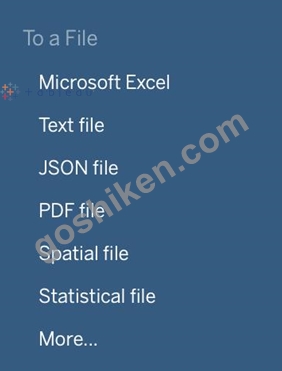
質問 # 22
Excel、テキスト ファイル データ、JSON ファイル、.pdf ファイル データを操作する場合、_________________ を使用してフォルダー間でファイルを結合し、ワークブック間でワークシートを結合できます。検索は、選択した接続に限定されます。
- A. 正規表現検索
- B. ユニオン検索
- C. パターン検索
- D. ワイルドカード検索
正解:D
解説:
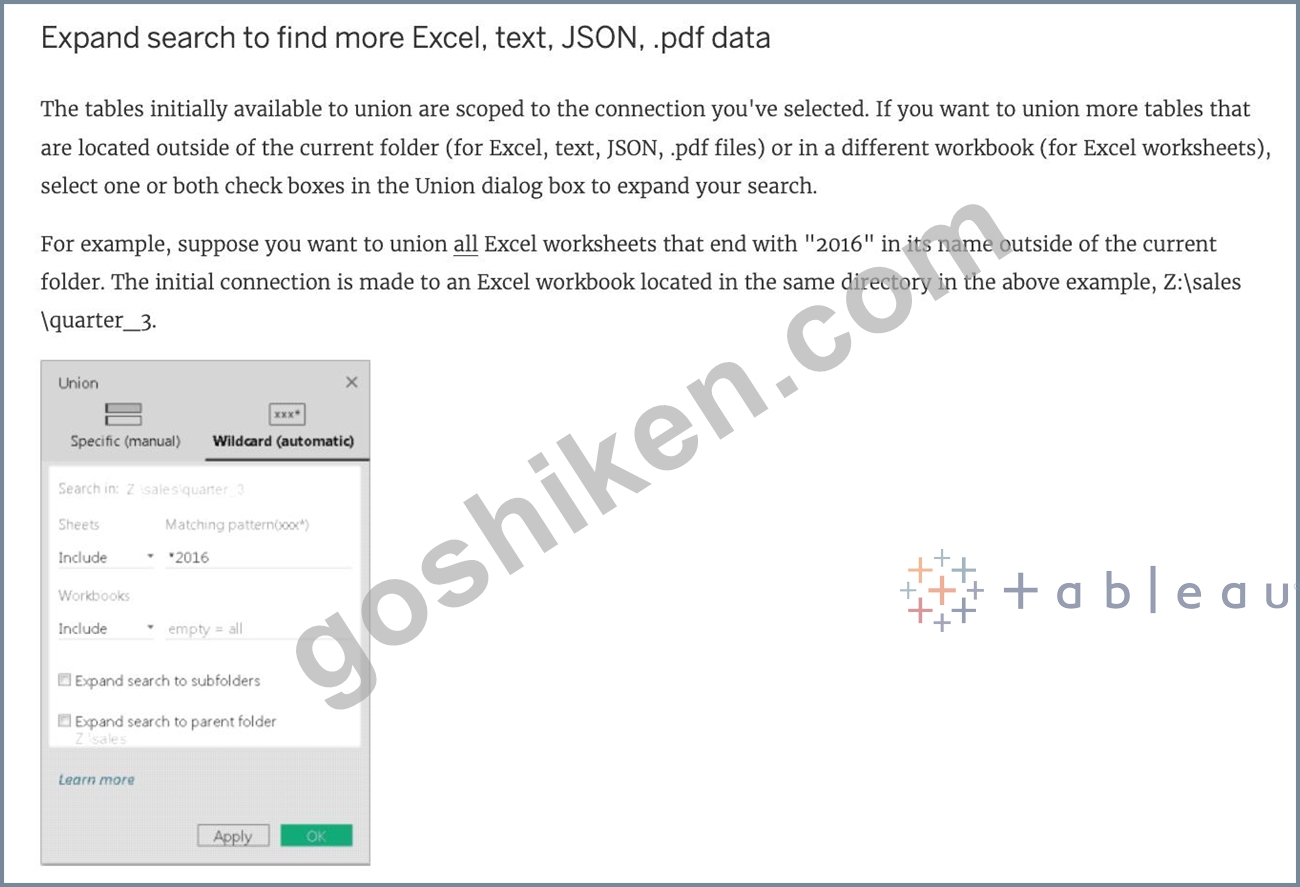
You can use Wildcard Search to set up search criteria to automatically include tables in your union. Use the wildcard character, which is an asterisk (*), to match a sequence or pattern of characters in the Excel workbook and worksheet names, Google Sheets workbook and worksheet names, text file names, JSON file names, .pdf file names, and database table names.
When working with Excel, text file data, JSON file, .pdf file data, you can also use this method to union files across folders, and worksheets across workbooks. Search is scoped to the selected connection. The connection and the tables available in a connection are shown on the left pane of the Data source page.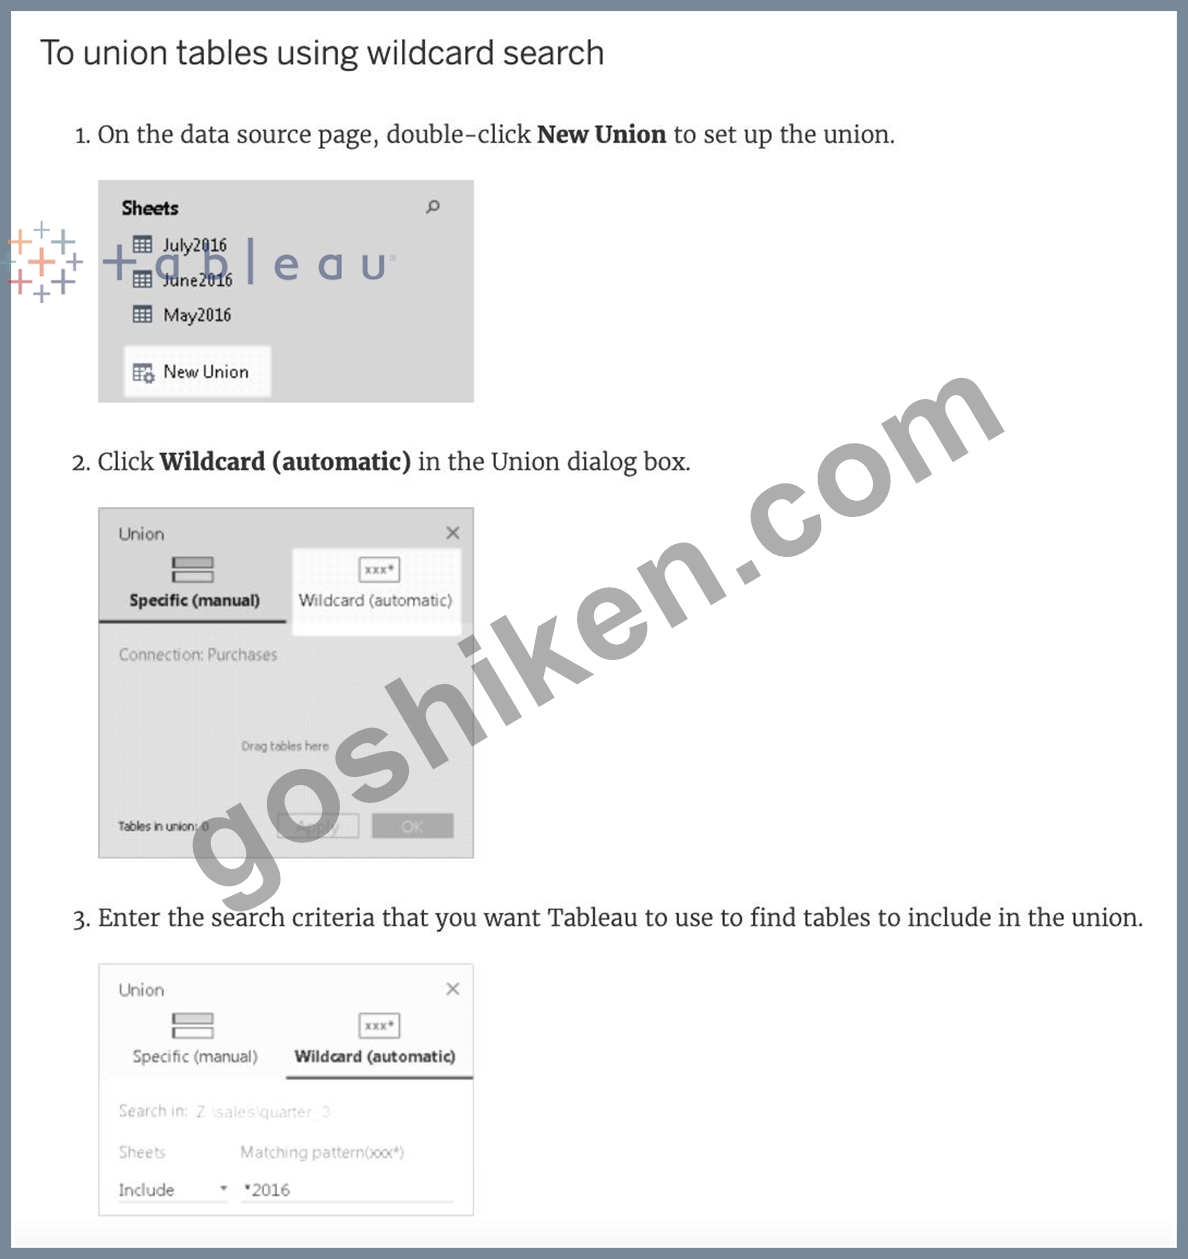
質問 # 23
次のビューがあるとします。新しいメジャーを行シェルフと列シェルフにドラッグした場合、マークの総数はどうなりますか?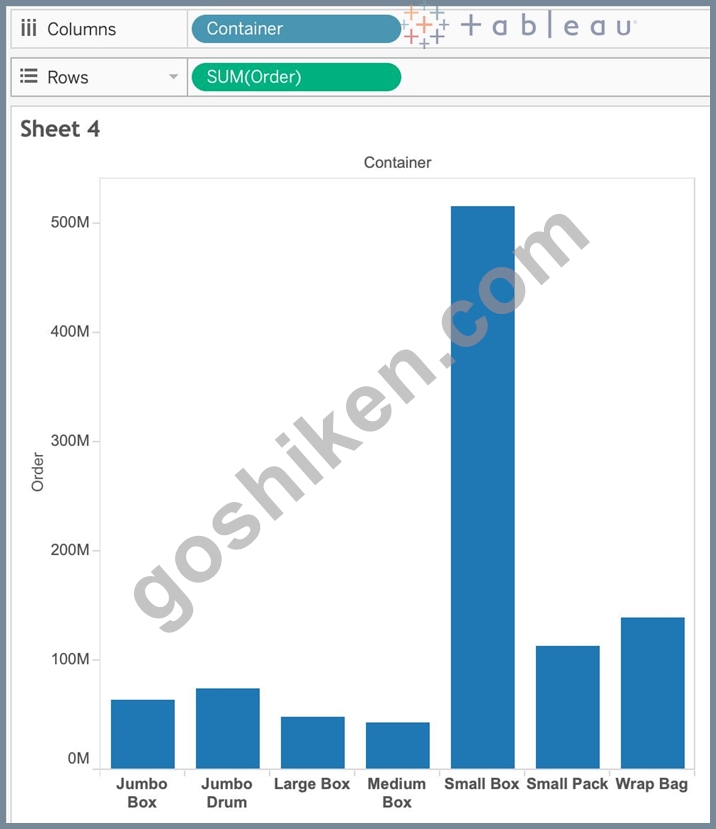
- A. 行棚にドラッグした場合: 7 マーク; 列の棚にドラッグした場合: 7 マーク
- B. 行棚にドラッグした場合: 14 マーク; 列の棚にドラッグした場合: 14 マーク
- C. 行棚にドラッグした場合: 14 マーク; 列の棚にドラッグした場合: 7
マーク - D. 行棚にドラッグした場合: 7 マーク; 列の棚にドラッグした場合: 14 マーク
正解:C
解説:
This is a tricky question often asked in the exam.
If we drag a new measure to the row shelf, the following happens:
We now have 2 rows, and the same 7 columns for both these rows. Therefore, 2x7 = 14 marks!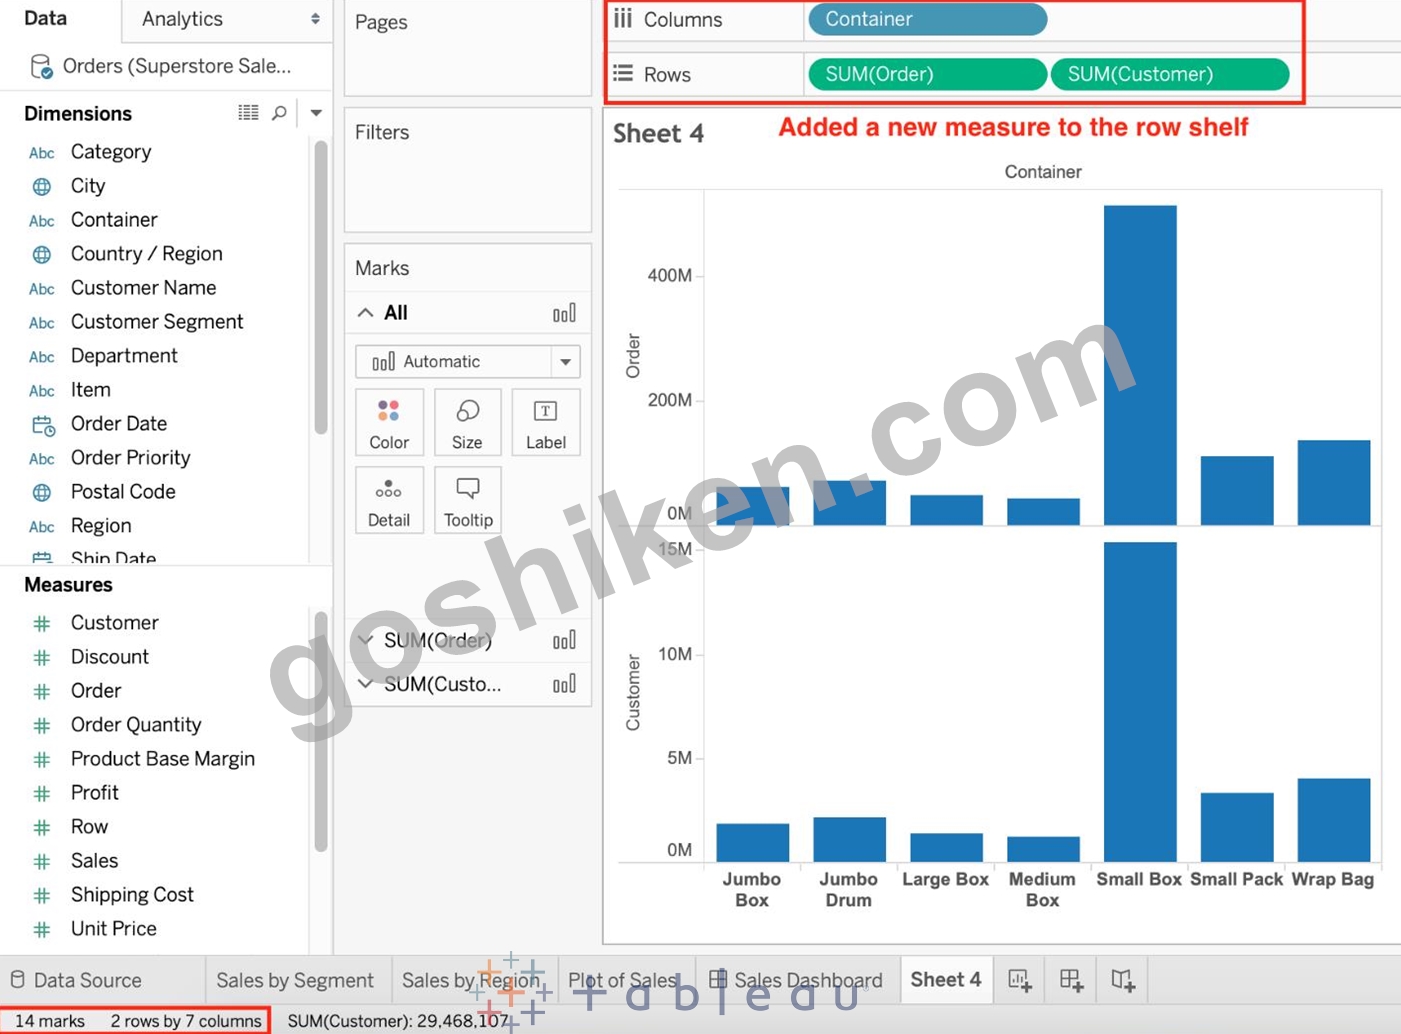
But if we drag the same measure to the column shelf, we have just 1 row and a chart created for each of the columns. So (1x7) = 7 marks!
Reference and notes: https://medium.com/@justindixon91/tableau-specialist-exam-notes-part-4-understanding-tableau-concepts-f78de83fdd35
質問 # 24
ツリー マップでは、サイズは ________________ の最大の長方形と ________________ の最小の長方形から始まります。
- A. 右上、左下
- B. 左上、右下
- C. 右上、右下
- D. 左上左下
正解:B
解説:
Tree maps size begins from maximum in top left to smallest in bottom right.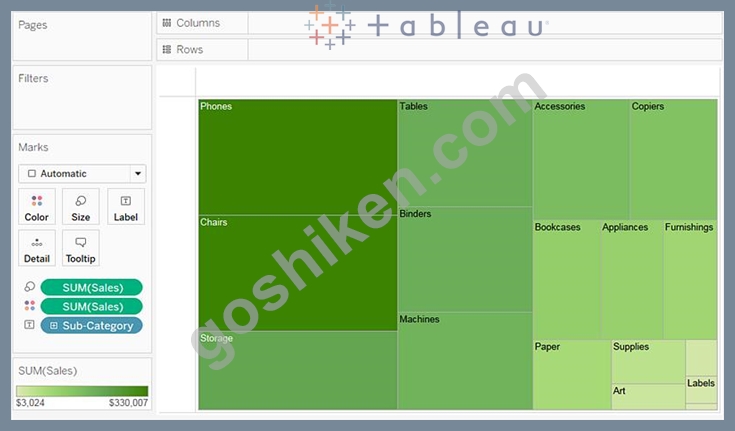
See below to learn how to create a TreeMap and add colours to it:
質問 # 25
時系列テーブルを使用して、年と四半期ごとに分類された各品揃えの売上を示すクロス集計を作成します。2017 年 10 月の第 4 四半期におけるハードウェアの品揃えの平均販売額は?
- A. 1,461
- B. 112,256
- C. 1,222
- D. 111,060
正解:B
解説:
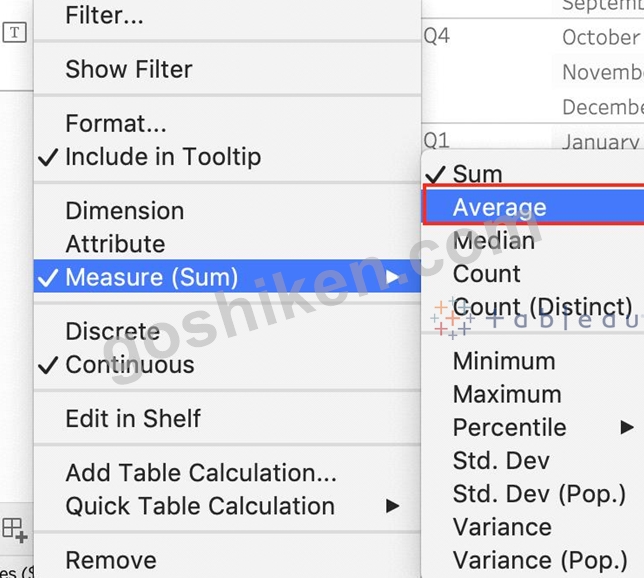
If you chose 111,060 you were SO close to the correct answer but made a small mistake - you didn't change the aggregation to AVERAGE! This is one of the common mistakes many test takers make, so keep this in mind.
To reach the correct answer, follow the steps below:
1) Draw Assortment to the Column shelf, and drag Year to the Rows Shelf. Then Drill down further on Year to accomodate Quarters and Months as well!
Although this seems enough, DON'T FORGET to change the aggregation like in the next step, which will completely change the values!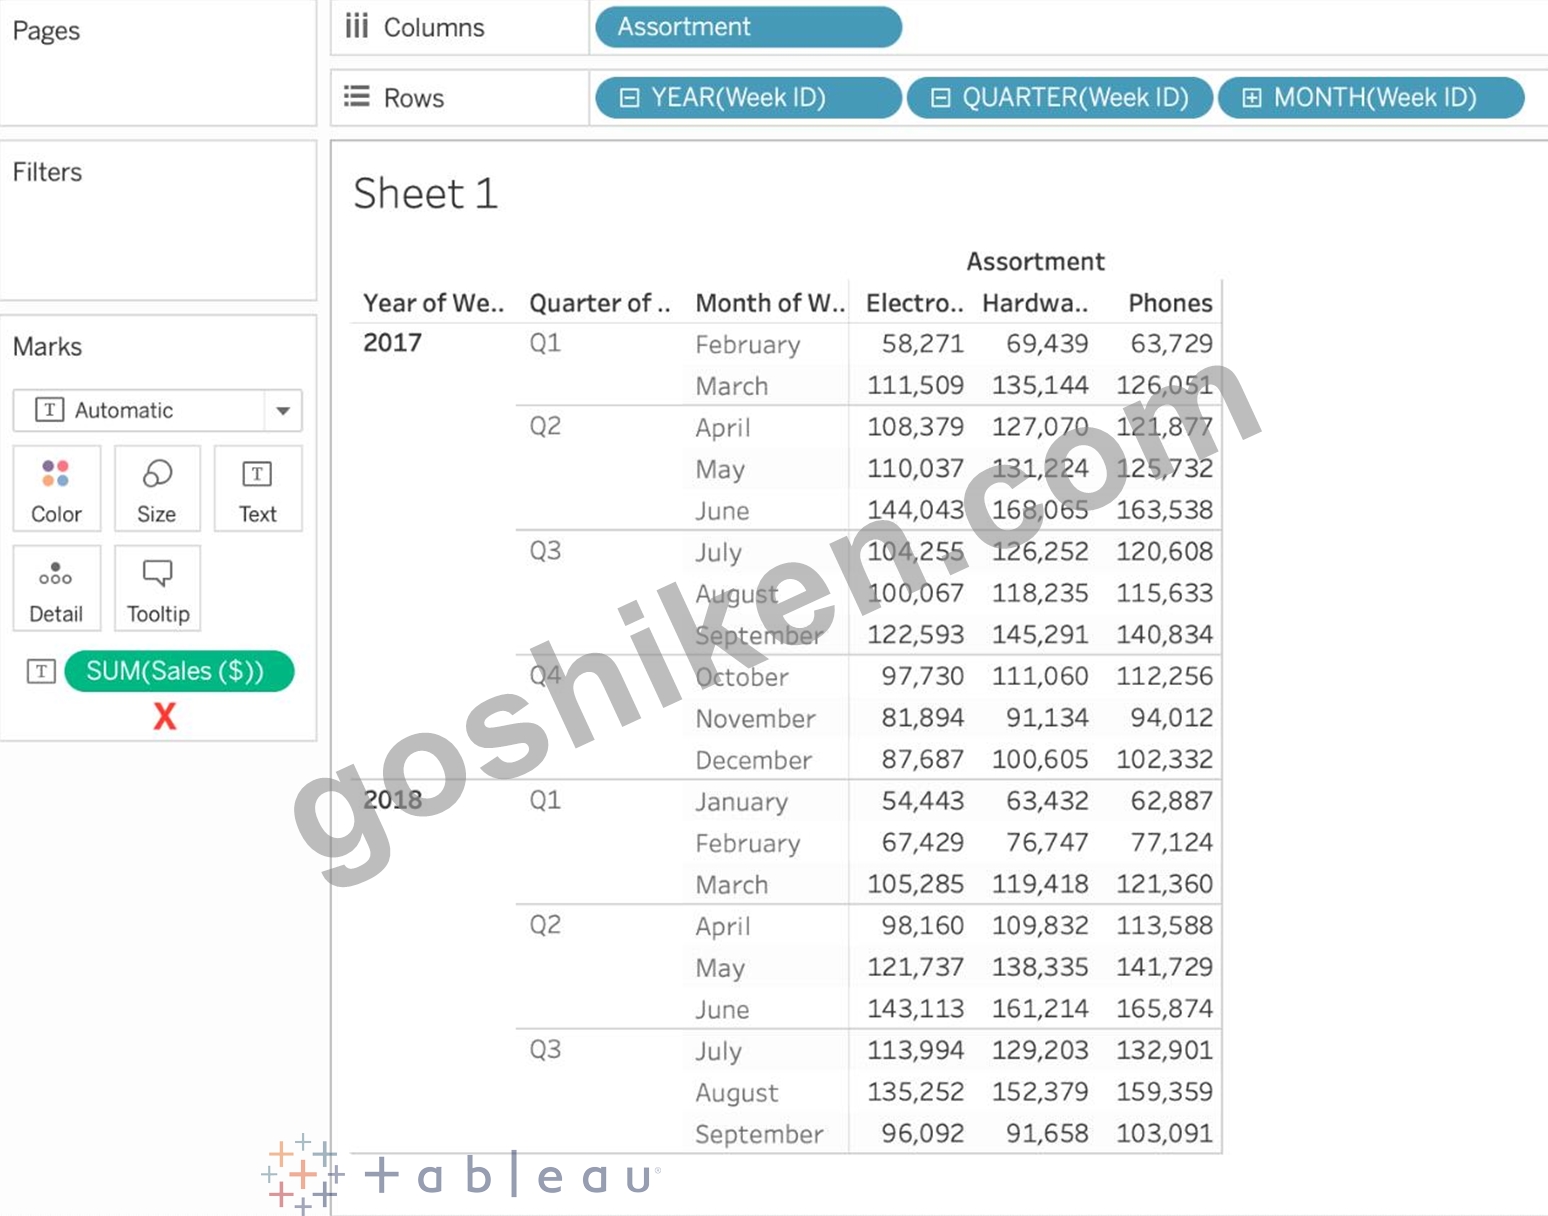
The correct answer as you can see is 1,461 - Sales for Harware Assortment in 2017 Q4, October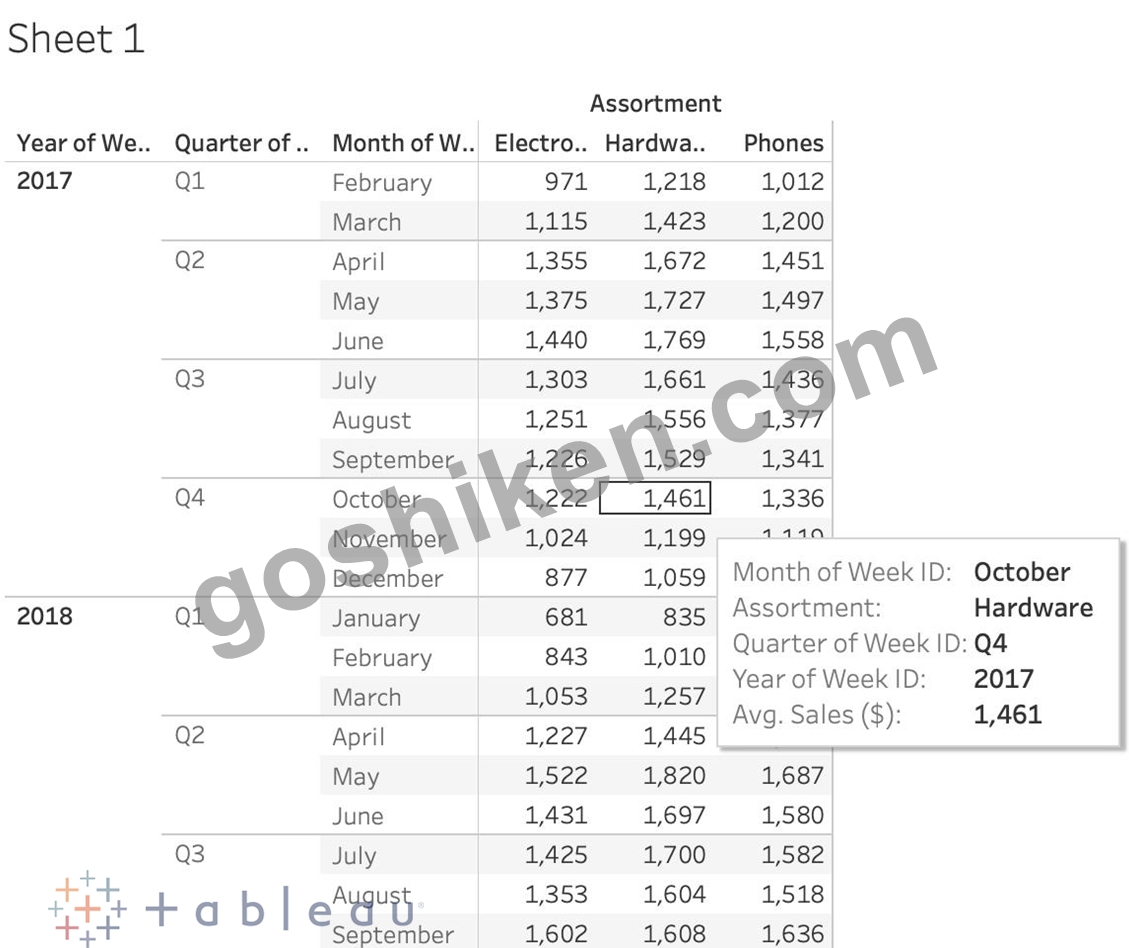
質問 # 26
______________ を色にドラッグすると、アイテムごとに異なる色が作成されますが、______________ を色にドラッグすると、グラデーションが作成されます
- A. 離散値、連続値
- B. 経度、緯度
- C. 連続値、離散値
- D. 地理的価値、離散的価値
正解:A
解説:
Remember that dragging a discrete value to colour creates distinct colours for each item whereas dragging a continuous value to colour creates a gradient. ( Same for Map ) From the official documentation: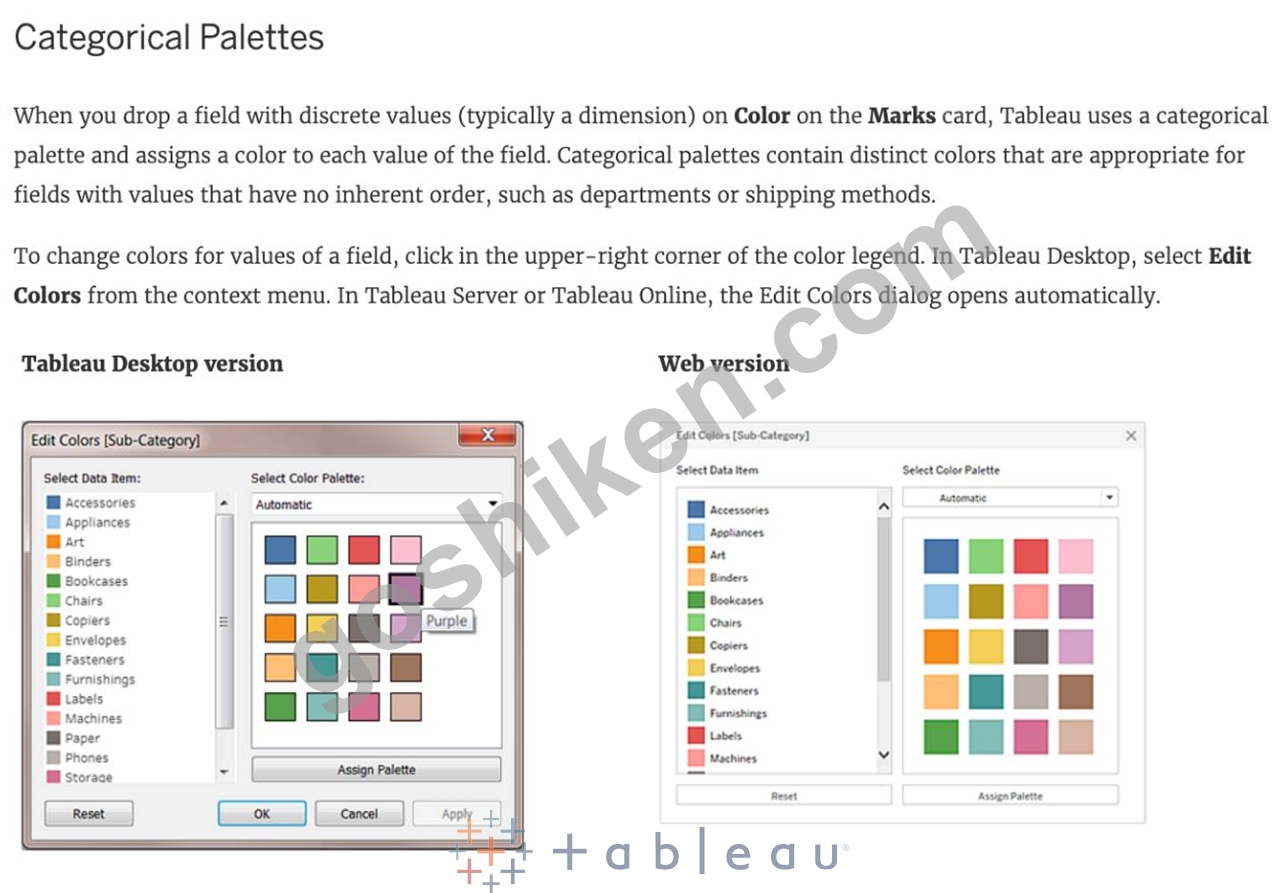

質問 # 27
フィールドに負の値と正の値の両方がある場合、既定の値の範囲では 2 つの色の範囲が使用されます。これは ______________ パレットと呼ばれます。
- A. 反転
- B. 発散
- C. 収束
- D. ステップ
正解:B
解説:
質問 # 28
次の 2 つのフィールドのうち、Tableau で削除できないものはどれですか?
- A. レコード数
- B. 測定値
- C. 小節名
- D. 計算フィールド
正解:B、C
解説:
Measure names and values CANNOT be deleted in Tableau like other columns can. These are auto-generated.
Calculated Fields, and Number of records can both be deleted.
質問 # 29
時系列テーブルを使用して、品揃えごとに分類された売上の前年比月次成長率を示す折れ線グラフを作成します。電化製品の品揃えについて、前年比成長率の値が最もマイナスだったのはどの月ですか?
時系列テーブルを使用して、品揃えごとに分類された売上の前年比月次成長率を示す折れ線グラフを作成します。電化製品の品揃えについて、前年比成長率の値が最もマイナスだったのはどの月ですか?
- A. 7 月
- B. 9月
- C. 10月
- D. 6月
正解:C
解説:
Follow along:
1) Drag Assortment and Year ID (choose Discrete Month) to Columns shelf, and Sales to the Columns Shelf.
For sales, click on the pill -> choose Quick Table calculation -> Year over Year growth.
The view should now look like: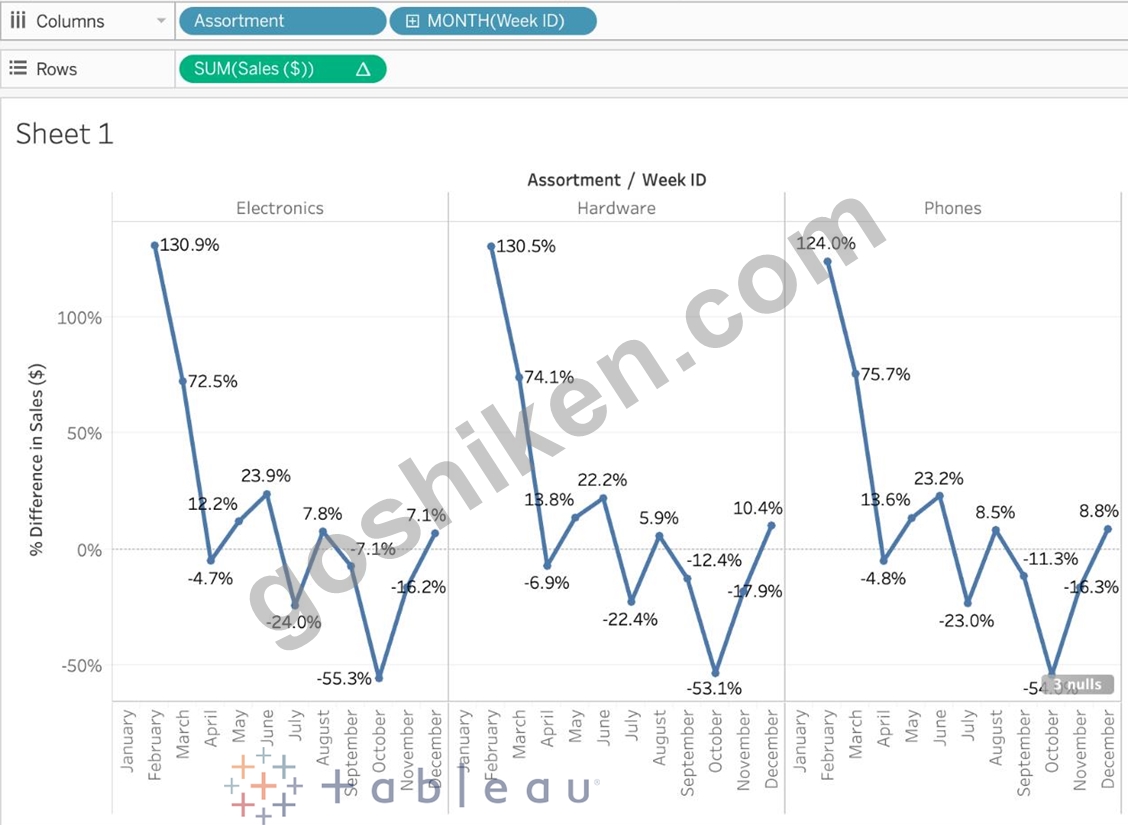
It is clear that October with -55.3% had the lowest Year on Year growth.
質問 # 30
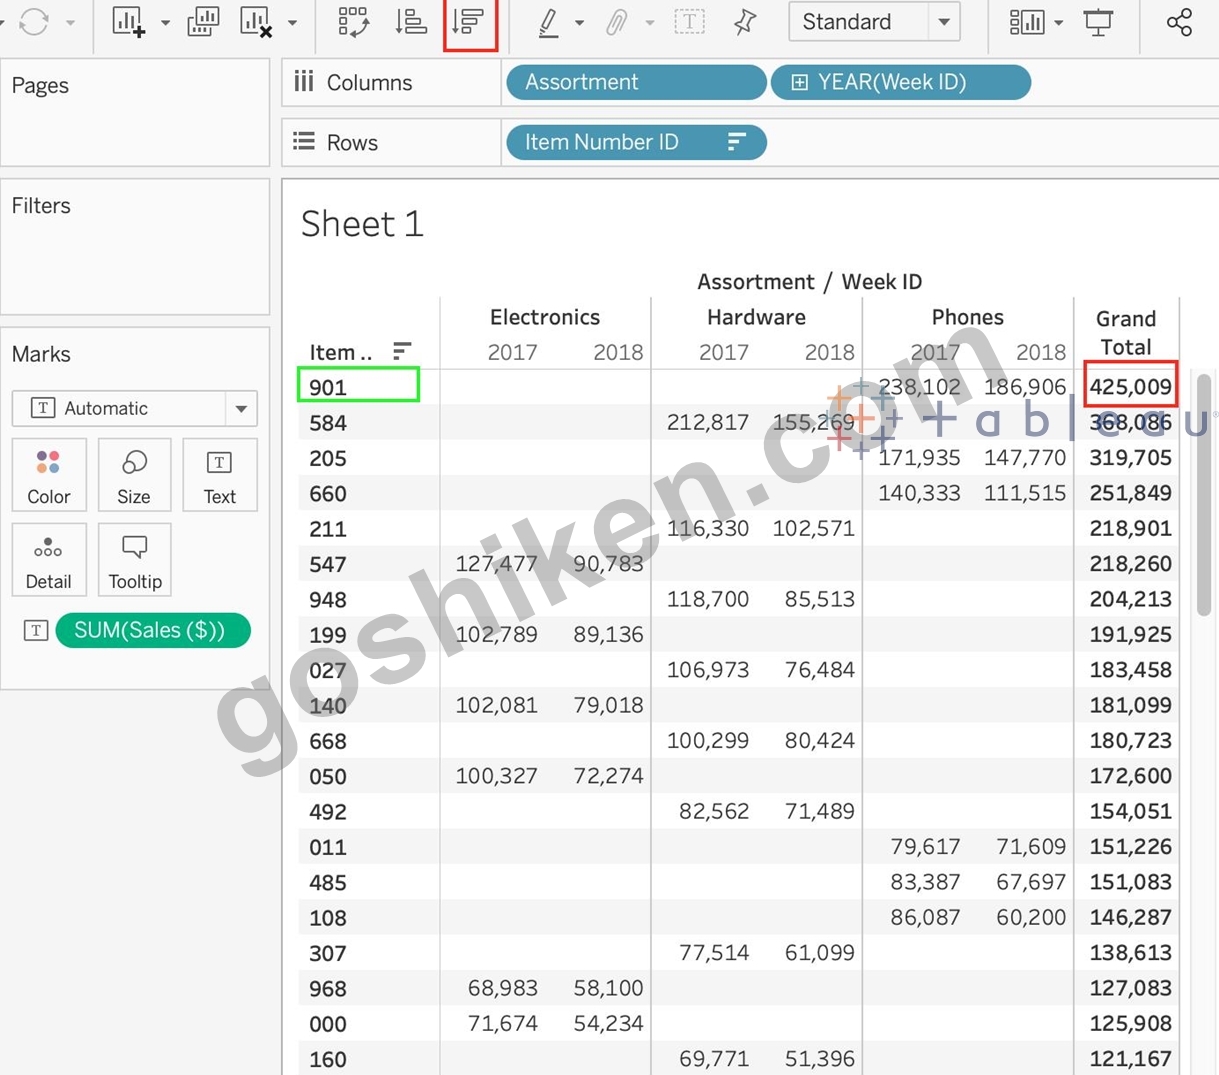
時系列テーブルを使用して、品目番号 ID ごとの売上を表示するクロス集計を作成し、品揃えごとに分類してから、ビューに総計を追加します。すべての品揃えで最大の売上を上げたアイテム番号 ID は?
- A. 0
- B. 1
- C. 正解)
- D. 2
- E. 3
正解:A
解説:
Follow along the steps below:
Drag Assortment and Year ID to the column shelf, and Item Number ID to the row shelf. Next, drag Sales to the Text label to create a cross-tab as below: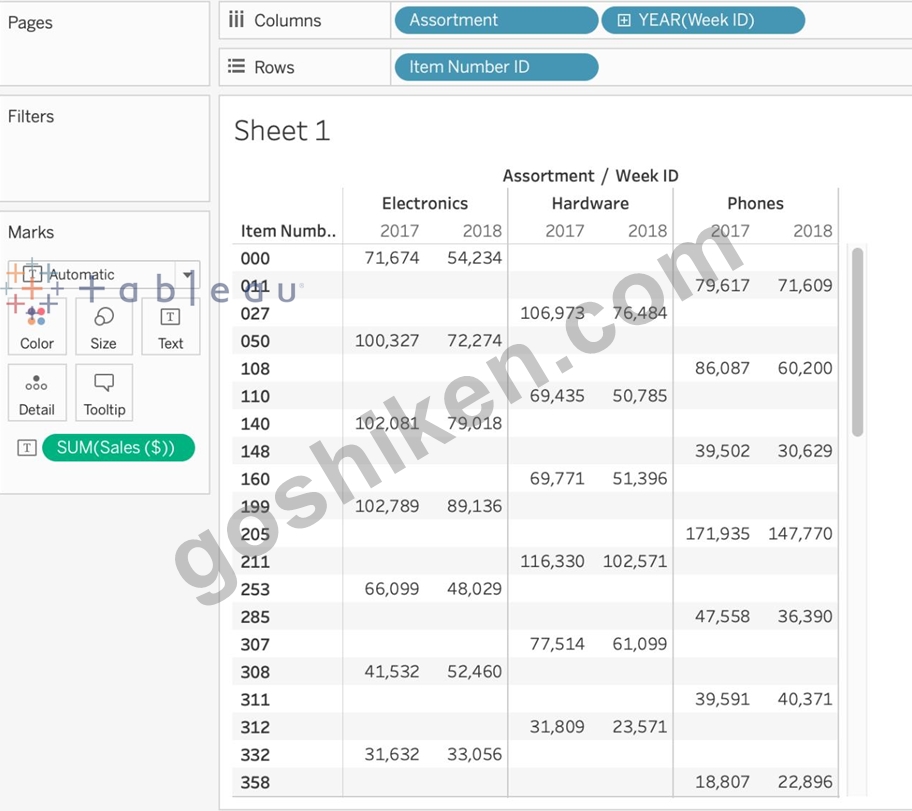
質問 # 31
正誤問題: シートをストーリー内で直接使用することはできません。ダッシュボード内でシートを使用するか、ストーリー内でダッシュボードを使用する必要があります。
- A. 偽
- B. ルエ
正解:A
解説:
It is possible in Tableau to use a sheet within a story directly.
Moreover, in Tableau, a story is a sequence of visualizations that work together to convey information. You can create stories to tell a data narrative, provide context, demonstrate how decisions relate to outcomes, or to simply make a compelling case.
At the same time, a story is also a collection of sheets, arranged in a sequence. Each individual sheet in a story is called a story point.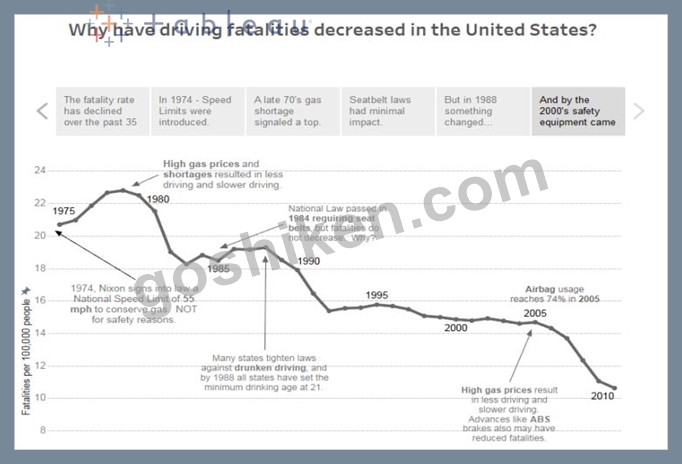
質問 # 32
寸法を正確に表す 3 つのステートメントはどれですか? 3つ選んでください。
- A. 定性的な値が含まれています
- B. 数値、定量的な値が含まれます。
- C. 連続または離散可能
- D. ビューの詳細レベルに影響します。
- E. ビューの書式設定オプションに影響します。
正解:A、C、D
解説:
Three statements that accurately describe dimensions are: Contain qualitative values Affect the level of detail in the view Can be continuous or discrete Dimensions are fields that contain qualitative values, such as names, dates, or geographical data. You can use dimensions to categorize, segment, and reveal the details in your data. Dimensions affect the level of detail in the view by creating headers or labels for marks or by defining how data is partitioned for table calculations. Dimensions can be continuous or discrete depending on their data type and format. Continuous dimensions are those that have an infinite range of possible values, such as numbers or ratios. Discrete dimensions are those that have a finite number of distinct values, such as names, categories, or dates3 The other options are not accurate statements about dimensions. Contain numeric, quantitative values is not correct, because fields that contain numeric, quantitative values are measures, not dimensions. Measures are fields that contain numeric values that you can measure and aggregate. Affect the formatting options in the view is not correct, because formatting options are not determined by dimensions, but rather by user preferences and choices. Formatting options allow you to change the appearance of various elements in the workbook, such as fonts, borders, shading, alignment, etc3
質問 # 33
.tds ファイルに保存されるのは次のうちどれですか? 3 を選択します。
- A. メタデータの編集
- B. データ接続情報
- C. ビジュアライゼーション
- D. データ抽出
- E. 計算フィールド
正解:A、B、E
解説:
If you've created a data connection that you might want to use with other workbooks or share with colleagues, you can export (save) the data source to a file. You might want to do this also if you've added joined tables, default properties, or custom fields-such as groups, sets, calculated fields, and binned fields-to the Data pane.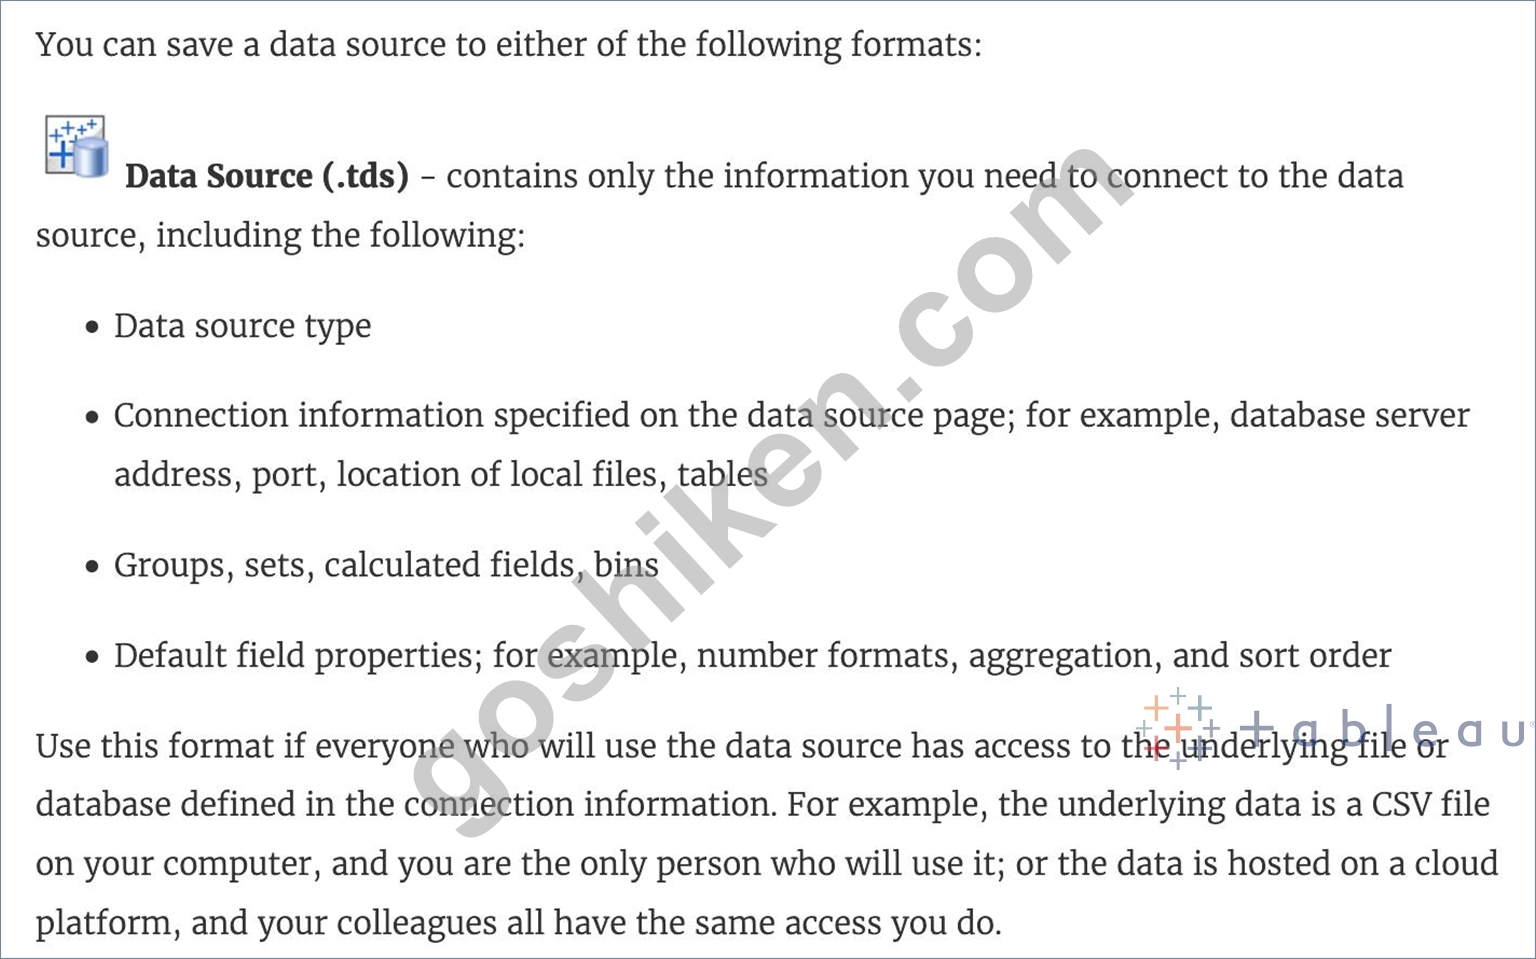
Visualisations and Data extracts are NOT saved in a .tds file!
質問 # 34
データセットを使用して、地域別に分類された平均数量を示す棒グラフを作成し、国別にフィルタリングして日本のみを表示します。東京州の平均数量は?
- A. 3.704
- B. 3.000
- C. 3.840
- D. 3.500
正解:A
質問 # 35
表計算や計算フィールドを必要とせずに使用できる集計はどれですか?
- A. 標準偏差
- B. 合計のパーセント
- C. サンプルの共分散
- D. 現在の合計
正解:A
解説:
Standard deviation is an aggregation that is available without requiring a table calculation or calculated field. Standard deviation is a statistical measure that shows how much variation there is from the average value in a set of data. Standard deviation is one of the predefined aggregations in Tableau that can be applied to any measure by selecting it from the context menu of the measure or from the drop-down menu on the Marks card6 The other options are not aggregations that are available without requiring a table calculation or calculated field. Running total, sample covariance, and percent of total are all examples of table calculations, which are computations that are applied to the values in an entire table or partition of a table. Table calculations can be created by selecting them from the context menu of a measure or by using functions in a calculated field7
質問 # 36
ビュー内のすべてのマークのサイズを均一に変更する必要があります。
あなたは何をするべきか?
- A. ツールバーの [フィット] ドロップダウン メニューを使用します。
- B. [マーク] カードで [ラベル] を選択し、[配置] を選択します。
- C. マーク カードでサイズを選択し、スライダーを使用してサイズを調整します
- D. メニューの「書式」を選択し、「セルサイズ」を選択します。
正解:C
解説:
You should select Size on the Marks card and use the slider to adjust the size to uniformly change the size for all marks in a view. The Size property on the Marks card allows you to control the size of marks in the view by moving the slider to the left or right. The Size slider affects different marks in different ways, such as making them bigger or smaller, wider or narrower, or thicker or thinner1 The other options are not valid ways to uniformly change the size for all marks in a view. Selecting Label on the Marks card and then selecting Alignment will allow you to change the position of labels on marks, not the size of marks2 Using the Fit dropdown menu on the toolbar will allow you to change how the view fits within the worksheet, not the size of marks3 Selecting Format on the menu, and then selecting Cell Size will allow you to change the height and width of cells in a text table, not the size of marks in other types of views4
質問 # 37
グループ化されたフィールドに関連付けられているアイコンは______________です
- A. =#
- B. ペーパー クリップ
- C. グローブ
- D. 交差点
正解:B
解説:
You can create a group to combine related members in a field. The icon associated with a group is a paper clip!
質問 # 38
トレンドラインを作成するために必要なものは次のうちどれですか?
- A. 反対軸の 2 つの小節、または日付と上の小節
対立する軸。 - B. 1 つのメジャー、または反対の軸上の日付とディメンション。
- C. 2 つのディメンション、または反対の軸上の日付とディメンション。
- D. 1小節のみ
正解:A
解説:
To create a trend line, we need:
質問 # 39
......
更新された公式認定はTDS-C01日本語認証済みのTDS-C01日本語問題集でPDF:https://www.goshiken.com/Tableau/TDS-C01-JPN-mondaishu.html