

無料PL-300サンプル問題で100%カバー率のリアル試験問題(更新された452問あります)
今すぐダウンロード!リアルMicrosoft PL-300試験問題集テストエンジン試験問題
Microsoft PL-300試験は、データアナリストがパワーBIのスキルと知識を検証するのに最適な方法です。この試験では、データモデルを作成および管理し、データを視覚化し、レポートとダッシュボードを作成する機能を検証します。試験に合格することにより、個人はPower BIを使用してビジネス上の問題を解決し、データ駆動型の決定を下す習熟度を示すことができます。
質問 # 216
How should you distribute the reports to the board? To answer, select the appropriate options in the answer area.
NOTE: Each correct selection is worth one point.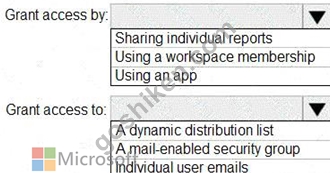
正解:
解説: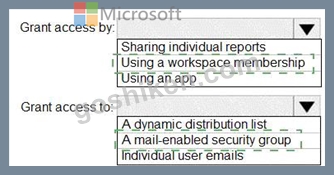
Explanation: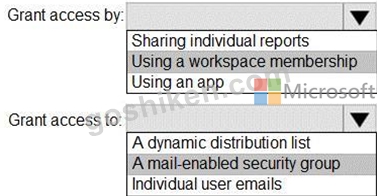
Box 1: Using a workspace membership
Scenario:
The company wants to provide a single package of reports to the board that contains custom navigation and links to supplementary information.
Note: Workspace is a shared environment for a group of people. You can have multiple Power BI content in a workspace. One workspace can have hundreds of dashboards, reports, and datasets in it.
Box 2: A mail-enabled security group
Scenario: Security Requirements
The reports must be made available to the board from powerbi.com. A mail-enabled security group will be used to share information with the board.
質問 # 217
You need to create a measure that will return the percentage of late orders.
How should you complete the DAX expression? To answer, select the appropriate options in the answer area.
NOTE: Each correct selection is worth one point.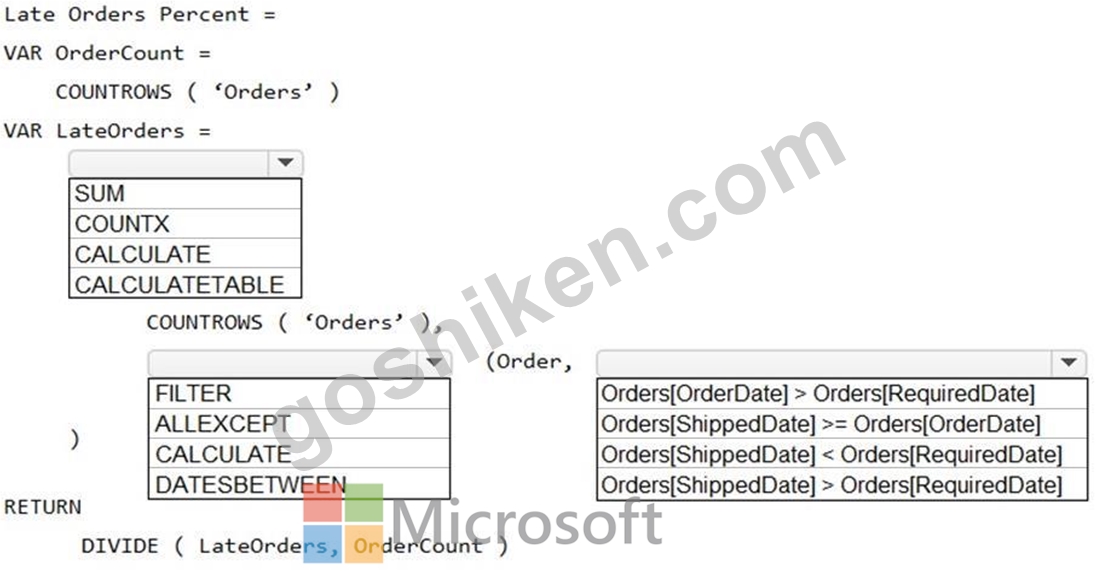
正解:
解説: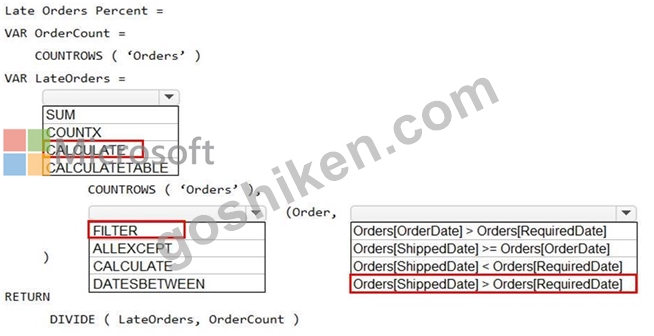
Reference:
https://docs.microsoft.com/en-us/dax/calculate-function-dax
https://docs.microsoft.com/en-us/dax/filter-function-dax
質問 # 218
You have a Microsoft Power Bl dashboard. The report used to create the dashboard uses an imported dataset from a Microsoft SQL Server data source. The dashboard is shown in the exhibit. (Click the Exhibit tab.)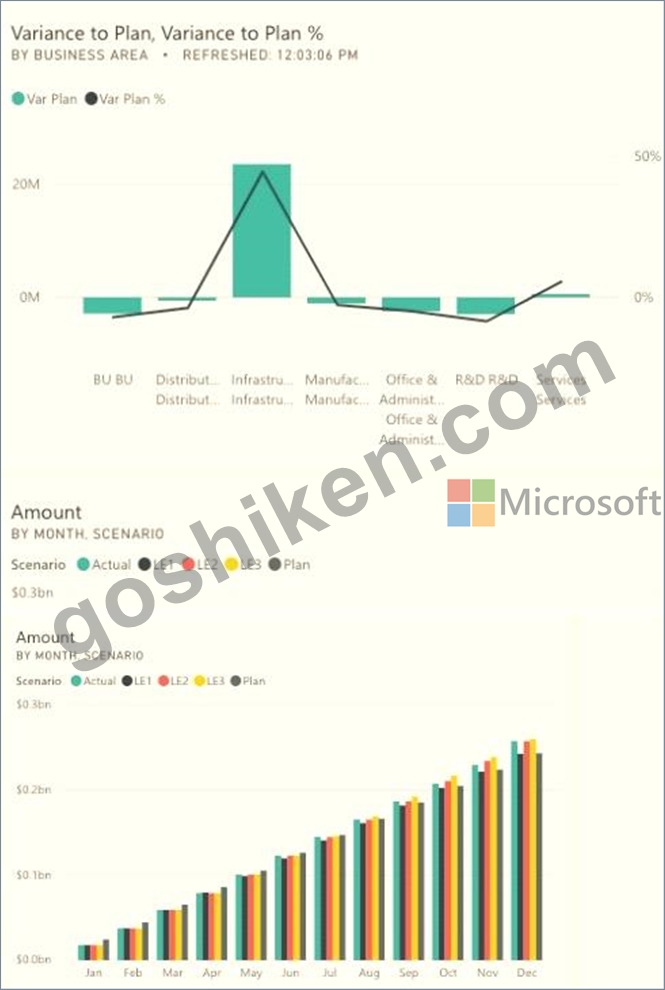
What occurred at 12:03:06 PM?
- A. A user pressed F5
- B. A new transaction was added to the data source.
- C. A user added a comment to a tile.
- D. The dashboard tile cache refreshed.
正解:A
解説:
Reference:
https://docs.microsoft.com/en-us/power-bi/connect-data/refresh-data
質問 # 219
You have a query that returns the data shown in the following exhibit.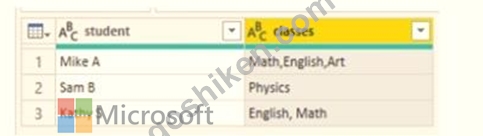
You need to configure the query to display the data as shown in the following exhibit.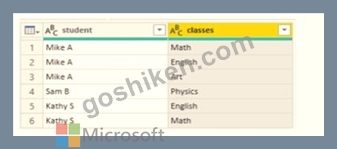
Which step should you use in the query?
- A. = Table.SplitColumn(Source, "classes". Splitter.SplitTextByDelimiterf",", QuoteStyle.None), {"classes.1"})
- B. = Table.SplitColumn(Source, "classes". Splitter.SplitTextByPositions({10}), {"classes.1"})
- C. =Table.ExpandListColum(Table.TransformColunins(Source, {{"classes". Splitter.SplitTextByDelimiter('','', QuoteStyle.None), let itemType - (type nullable text) meta [Serialized.Text = true] in type {itemType}}}), "classes")
- D. = Table.Unpivot(Source, {"classes"}, "Attribute", "Value")
正解:D
解説:
Power Query Unpivot columns: You might want to unpivot data, sometimes called flattening the data, to put it in a matrix format so that all similar values are in one column. This is necessary, for example, to create a chart or a report.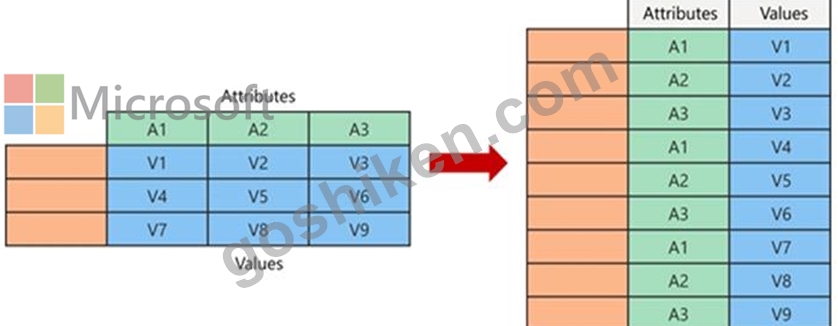
Note:
Syntax: Table.Unpivot(table as table, pivotColumns as list, attributeColumn as text, valueColumn as text) as table Table.Unpivot translates a set of columns in a table into attribute-value pairs, combined with the rest of the values in each row.
Reference:
https://docs.microsoft.com/en-us/power-query/unpivot-column
https://docs.microsoft.com/en-us/powerquery-m/table-unpivot
質問 # 220
You have a Power BI tenant.
You have reports that use financial datasets and are exported as PDF files.
You need to ensure that the reports are encrypted.
What should you implement?
- A. dataset certifications
- B. Microsoft Intune policies
- C. row-level security (RLS)
- D. sensitivity labels
正解:D
解説:
General availability of sensitivity labels in Power BI.
Microsoft Information Protection sensitivity labels provide a simple way for your users to classify critical content in Power BI without compromising productivity or the ability to collaborate. Sensitivity labels can be applied on datasets, reports, dashboards, and dataflows. When data is exported from Power BI to Excel, PowerPoint or PDF files, Power BI automatically applies a sensitivity label on the exported file and protects it according to the label's file encryption settings. This way your sensitive data remains protected no matter where it is.
Reference:
https://powerbi.microsoft.com/en-us/blog/announcing-power-bi-data-protection-ga-and-introducing-new-capabil
質問 # 221
You have the visual shown in the exhibit. (Click the Exhibit tab.)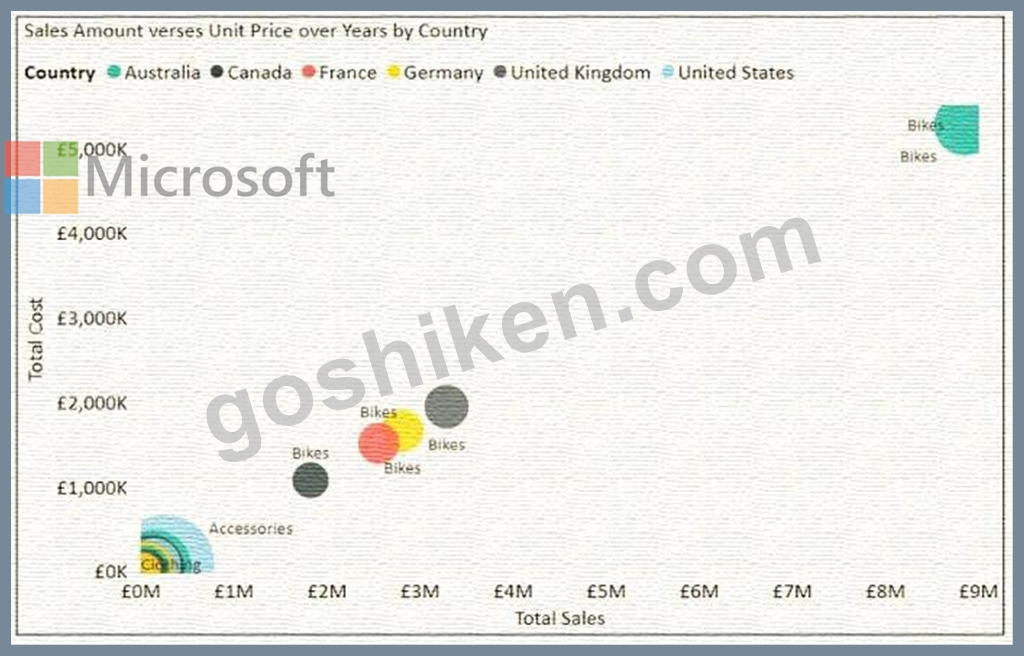
You need to show the relationship between Total Cost and Total Sales over time.
What should you do?
- A. From the Analytics pane, add an Average line.
- B. Add a slicer for the year.
- C. Add a play axis.
- D. Create a DAX measure that calculates year-over-year growth.
正解:C
解説:
You can set up a date field in play axis, and then scatter chart will animate how measure values are compared to each other in each point of a time.
Reference:
https://radacad.com/storytelling-with-power-bi-scatter-chart
質問 # 222
You build a report about warehouse inventory dat
a. The dataset has more than 10 million product records from 200 warehouses worldwide. You have a table named Products that contains the columns shown in the following table.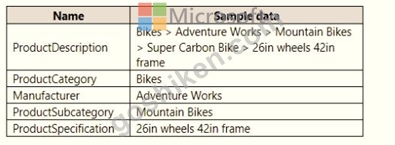
Warehouse managers report that it is difficult to use the report because the report uses only the product name in tables and visuals. The product name is contained within the ProductDescription column and is always the fourth value.
You need to modify the report to support the warehouse managers requirement to explore inventory levels at different levels of the product hierarchy. The solution must minimize the model size.
Which three actions should you perform in sequence? To answer, move the appropriate actions from the list of actions to the answer area and arrange them in the correct order.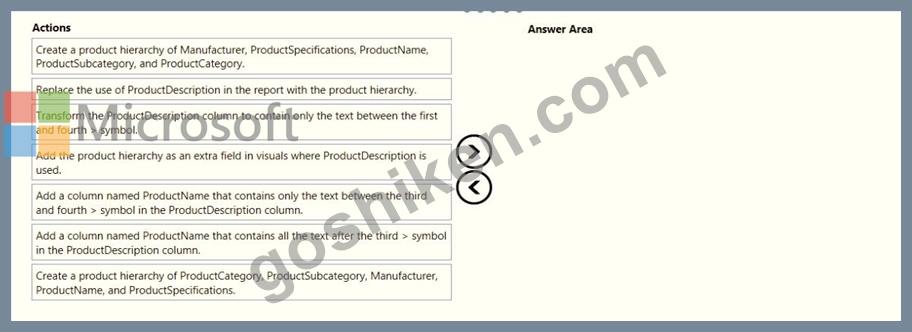
正解:
解説: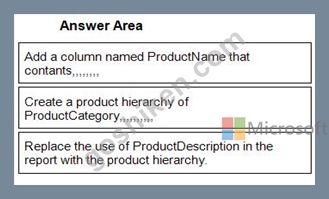
1 - Add a column named ProductName that contants,,,,,,,,
2 - Create a product hierarchy of ProductCategory,,,,,,,,,,
3 - Replace the use of ProductDescription in the report with the product hierarchy.
質問 # 223
You need to create a measure that will return the percentage of late orders.
How should you complete the DAX expression? To answer, select the appropriate options in the answer area.
NOTE: Each correct selection is worth one point.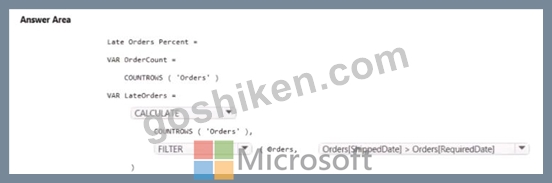
正解:
解説:
質問 # 224
You view a query named Transactions as shown in the following exhibit.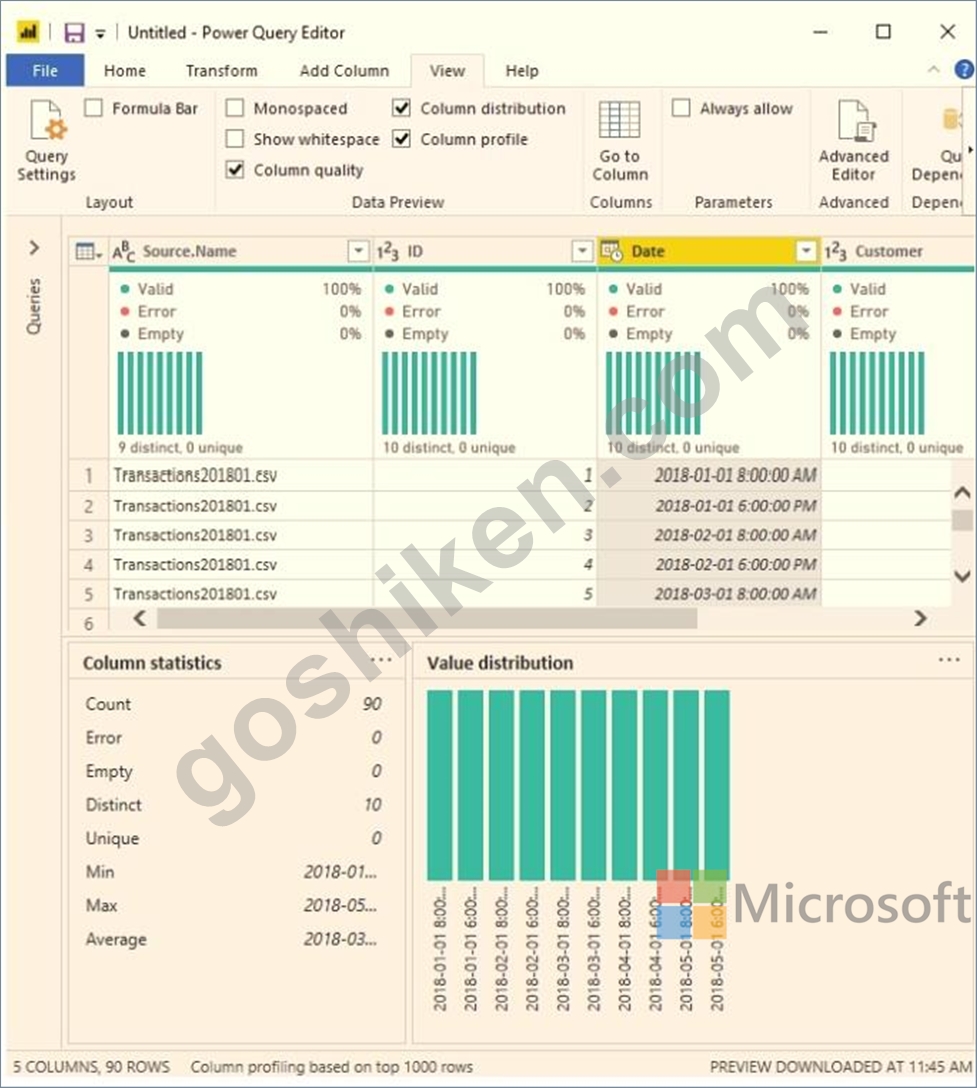
The query gets CSV files from a folder.
Use the drop-down menus to select the answer choice that completes each statement based on the information presented in the graphic.
NOTE: Each correct selection is worth one point.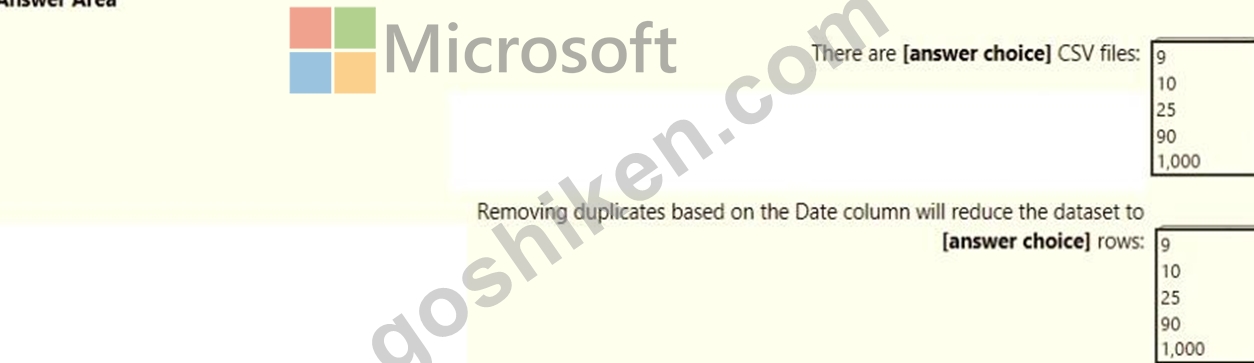
正解:
解説: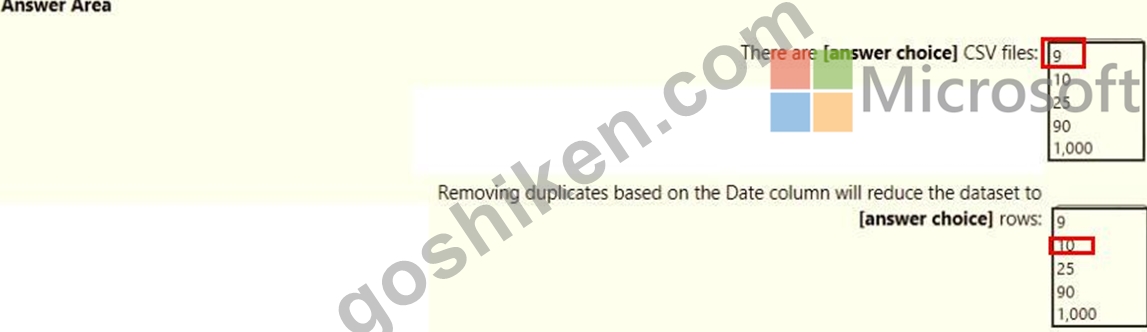
質問 # 225
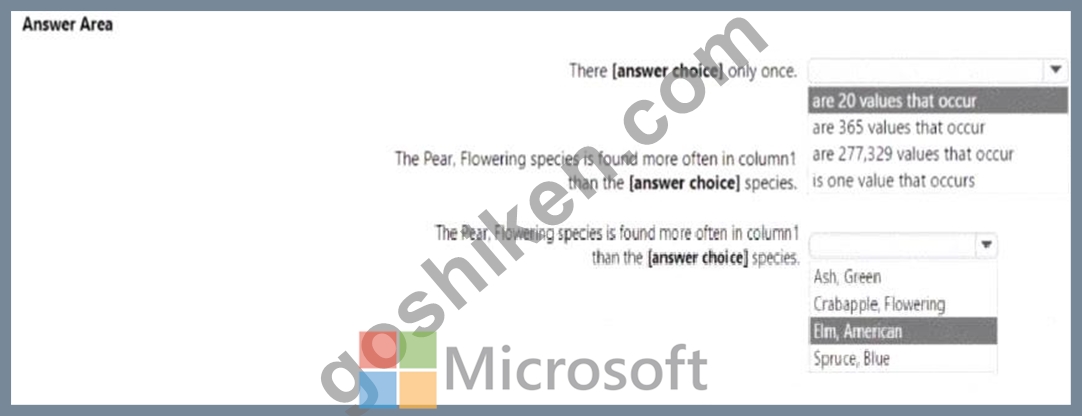
You are profiling data by using Power Query Editor.
You have a table that contains a column named column1. Column statistics and Value distribution for column1 are shown in the following exhibit.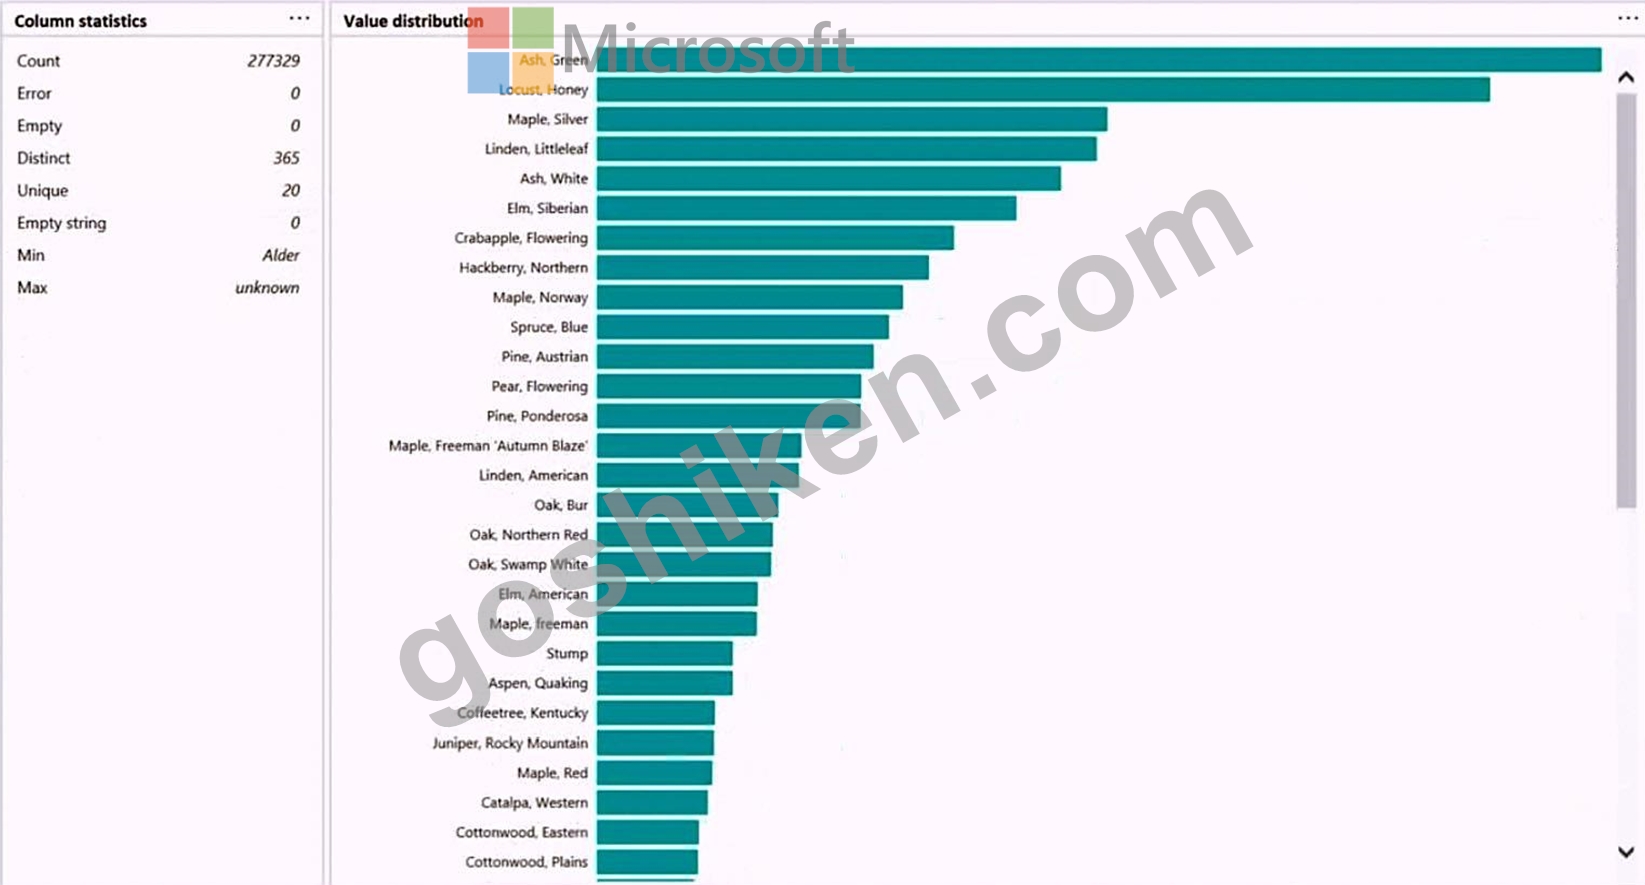
正解:
解説: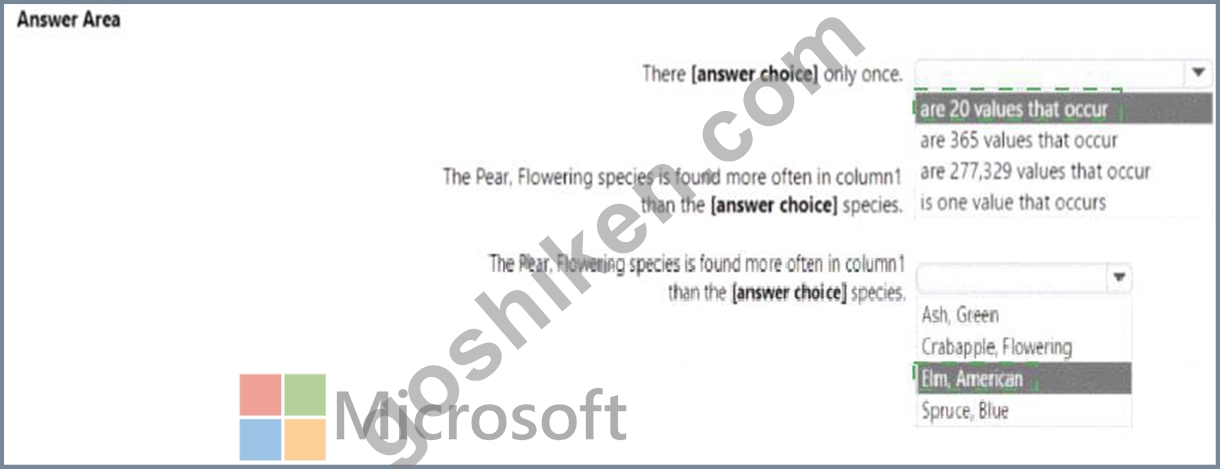
Explanation:
質問 # 226
You have a Power Bl table named Customer that contains a field named Email Address.
You discover that multiple records contain the same email address.
You need to create a calculated column to identify which records have duplicate email addresses.
How should you complete the OAX expression for the calculated column? To answer, drag the appropriate values to the correct targets. Each value may be used once, more than once, or not at all. You may need to drag the split bar between panes or scroll to view content NOTE: Each correct selection is worth one point.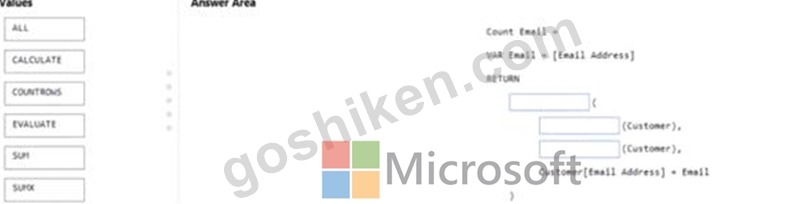
正解:
解説: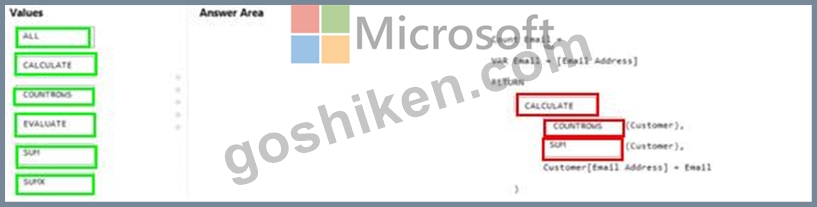
質問 # 227
Which two types of visualizations can be used in the balance sheet reports to meet the reporting goals? Each correct answer presents part of the solution.
NOTE: Each correct selection is worth one point.
- A. a ribbon chart that shows balances by quarter and accounts in the legend.
- B. a pie chart that shows balances by account category without filters.
- C. a line chart that shows balances by quarter filtered to account categories that are long-term liabilities.
- D. a clustered column chart that shows balances by date (x-axis) and account category (legend) without filters.
- E. a clustered column chart that shows balances by quarter filtered to account categories that are long-term liabilities.
正解:A、C
解説:
https://docs.microsoft.com/en-us/power-bi/visuals/power-bi-visualization-types-for-reports-and-q-and-a
Topic 2, Litware, Inc.
Overview
This is a case study. Case studies are not timed separately. You can use as much exam time as you would like to complete each case. However, there may be additional case studies and sections on this exam. You must manage your time to ensure that you are able to complete all questions included on this exam in the time provided.
To answer the questions included in a case study, you will need to reference information that is provided in the case study. Case studies might contain exhibits and other resources that provide more information about the scenario that is described in the case study. Each question is independent of the other questions in this case study.
At the end of this case study, a review screen will appear. This screen allows you to review your answers and to make changes before you move to the next section of the exam. After you begin a new section, you cannot return to this section.
To start the case study
To display the first question in this case study, click the Next button. Use the buttons in the left pane to explore the content of the case study before you answer the questions. Clicking these buttons displays information such as business requirements, existing environment and problem statements. If the case study has an All Information tab, note that the information displayed is identical to the information displayed on the subsequent tabs. When you are ready to answer a question, click the Question button to return to the question.
Overview
Litware, Inc. is an online retailer that uses Microsoft Power Bl dashboards and reports.
The company plans to leverage data from Microsoft SQL Server databases, Microsoft Excel files, text files, and several other data sources.
Litware uses Azure Active Directory (Azure AD) to authenticate users.
- Existing Environment
Sales Data
Litware has online sales data that has the SQL schema shown in the following table.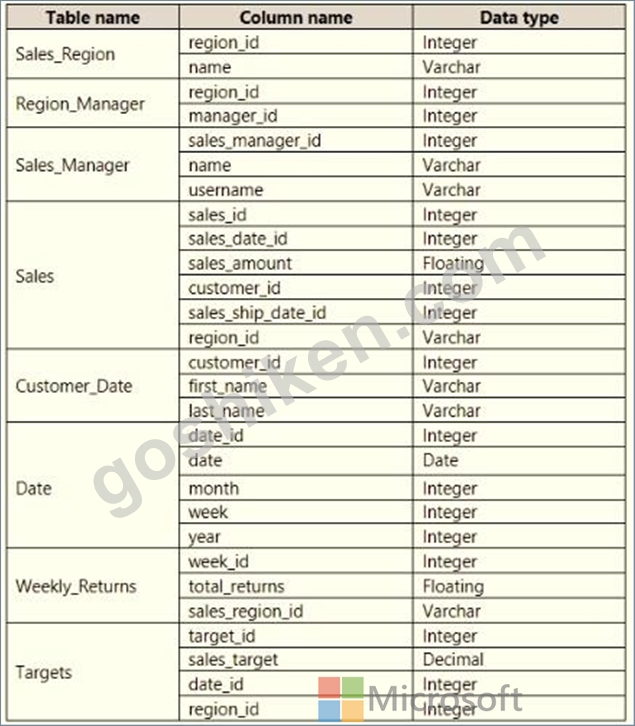
In the Date table, the dateid column has a format of yyyymmdd and the month column has a format of yyyymm. The week column in the Date table and the weekid column in the Weekly_Returns table have a format of yyyyww. The regionid column can be managed by only one sales manager.
Data Concerns
You are concerned with the quality and completeness of the sales data. You plan to verify the sales data for negative sales amounts.
Reporting Requirements
Litware identifies the following technical requirements:
* Executives require a visual that shows sales by region.
* Regional managers require a visual to analyze weekly sales and returns.
* Sales managers must be able to see the sales data of their respective region only.
* The sales managers require a visual to analyze sales performance versus sales targets.
* The sale department requires reports that contain the number of sales transactions.
* Users must be able to see the month in reports as shown in the following example: Feb 2020.
* The customer service department requires a visual that can be filtered by both sales month and ship month independently.
質問 # 228
You are enhancing a Power BI model that has DAX calculations.
You need to create a measure that returns the year-to-date total sales from the same date of the previous calendar year.
Which DAX functions should you use? To answer, select the appropriate options in the answer area.
NOTE: Each correct selection is worth one point.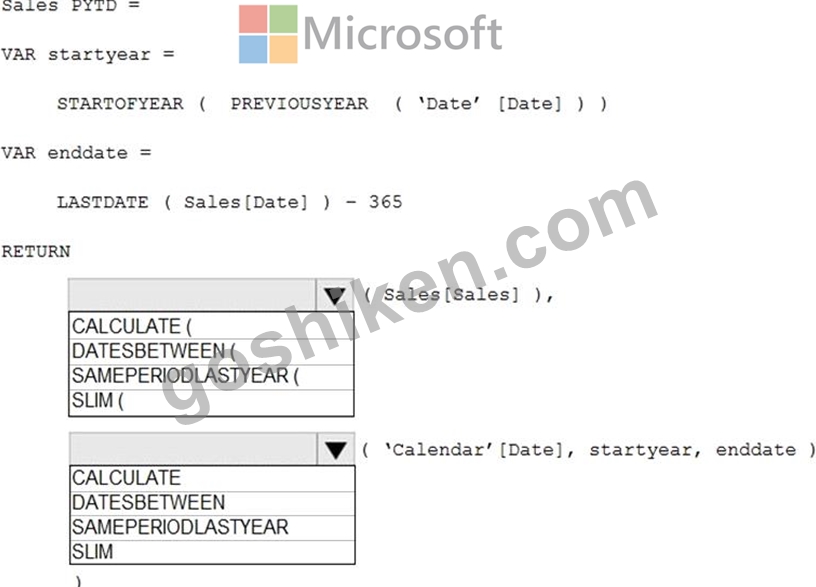
正解:
解説: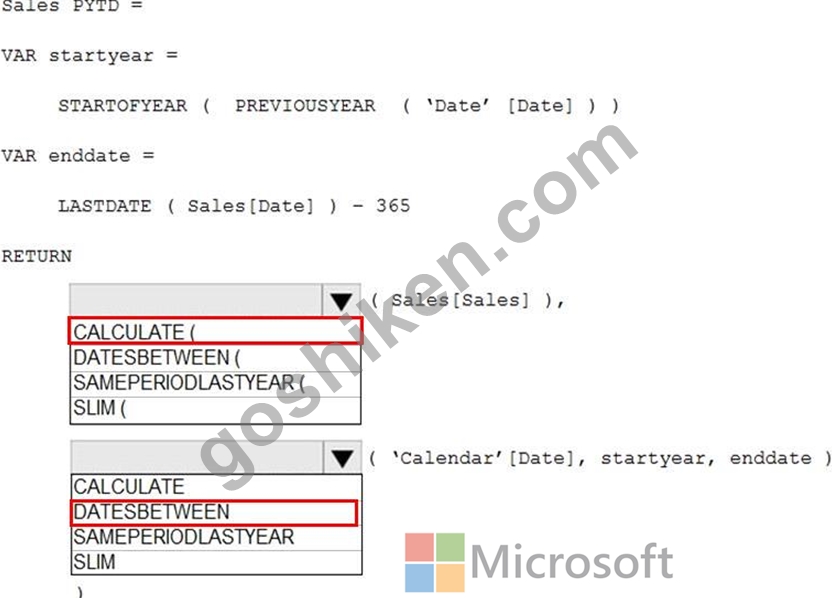
Reference:
https://www.kasperonbi.com/get-the-ytd-of-the-same-period-last-year/
質問 # 229
You are profiling data by using Power Query Editor.
You have a table that contains a column named column1. Column statistics and Value distribution for column1 are shown in the following exhibit.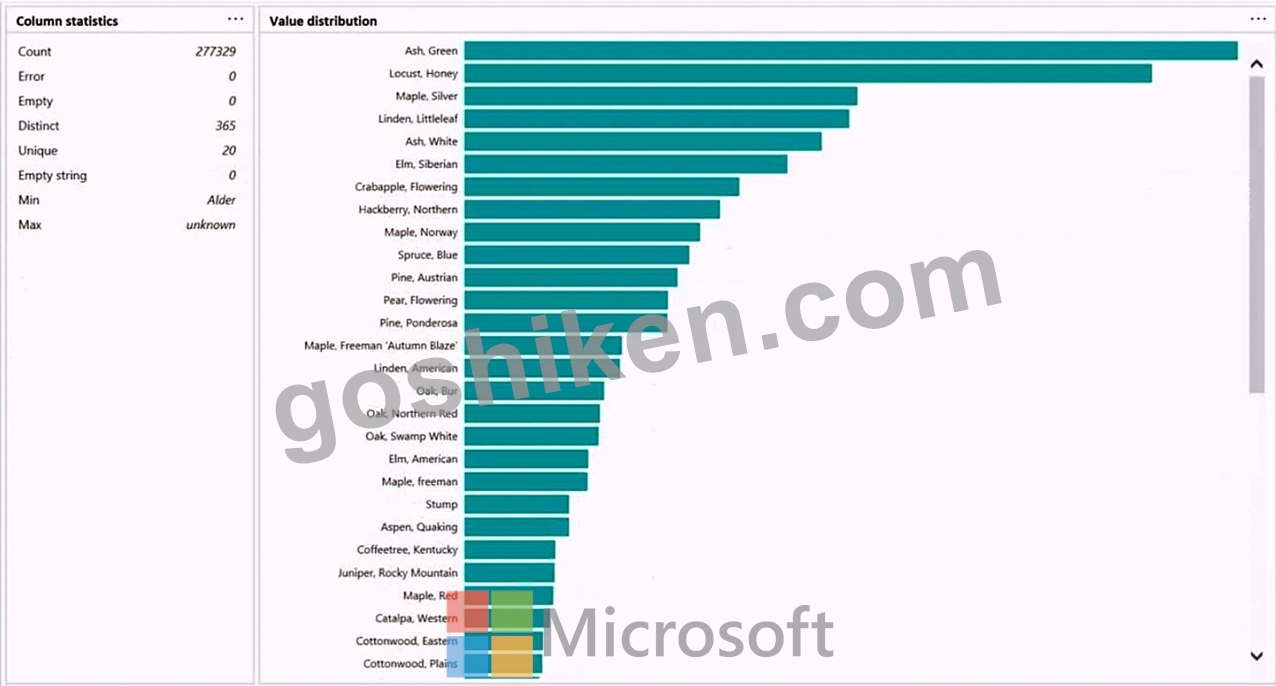
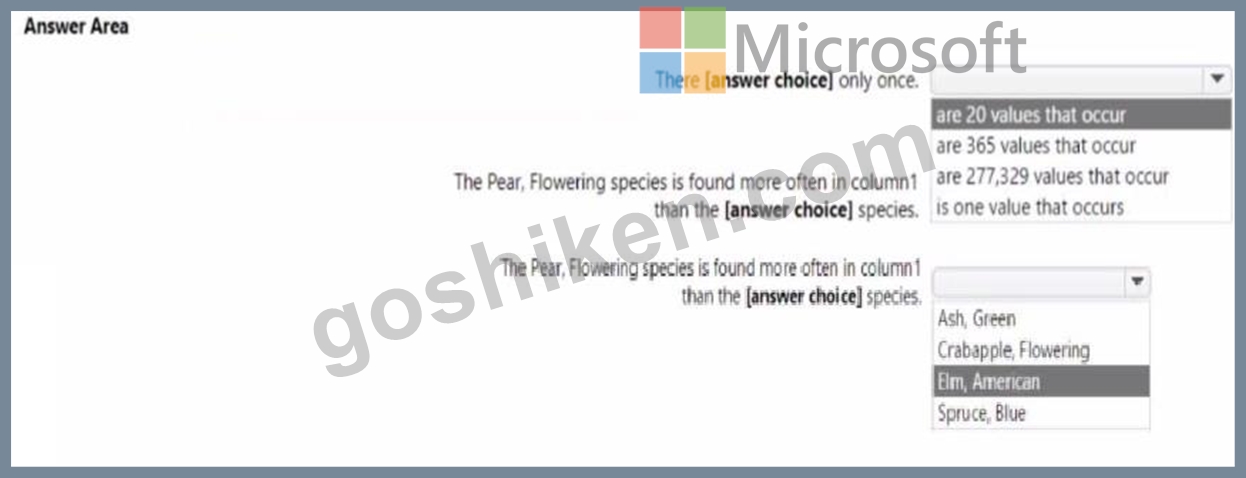
正解:
解説: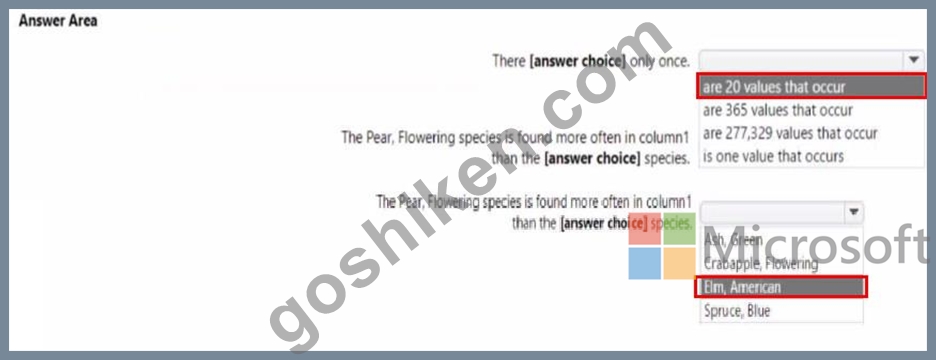
質問 # 230
Remove unused columns from tables in the data model. This will reduce the size of your PBIX file and make your data model more efficient. You can use Power Query Editor to remove any columns that are not used in your report or calculations.
You need to shape the query to display the following three columns: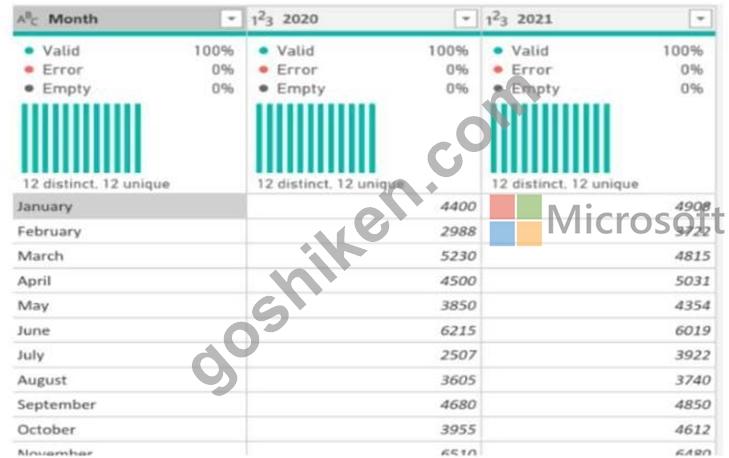
* Month
* Sales
* Year
'What should you select in Power Query Editor?
- A. Transpose
- B. Pivot column
- C. Unpivot columns.
- D. Merge columns
正解:C
解説:
Explanation
This will convert your column headers (Jan-20, Feb-20,...) into row values under a new column called Attribute. You can then rename this column as Month and change its data type to Date. You will also have a new column called Value that contains the sales amounts for each month. You can rename this column as Sales and change its data type to Decimal Number.
質問 # 231
You have a Power B1 model that contains a table named Date. The table has the following columns.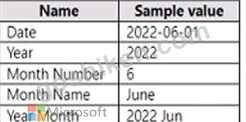
正解:
解説:
Answer is below.
質問 # 232
SIMULATION
You need to create the Top Customers report.
Which type of filter should you use, and at which level should you apply the filter? To answer, select the appropriate options in the answer area.
NOTE; Each correct selection is worth one point.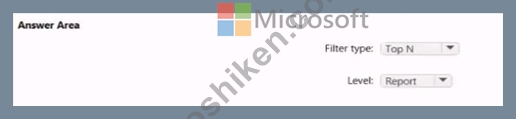
正解:
解説:
See the answer as below in explanation
Explanation:
Explanation.
Answer as below
質問 # 233
You are building a dataset from a JSON file that contains an array of documents.
You need to import attributes as columns from all the documents in the JSON file. The solution must ensure that date attributes can be used as date hierarchies in Microsoft Power BI reports.
Which three actions should you perform in sequence? To answer, move the appropriate actions from the list of actions to the answer area and arrange them in the correct order.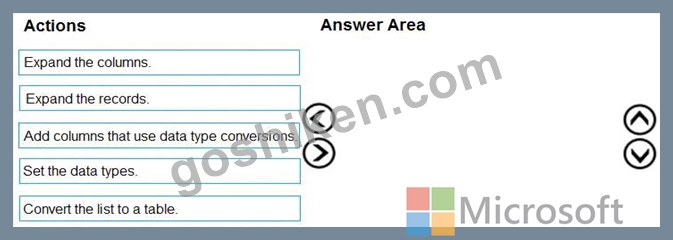
正解:
解説: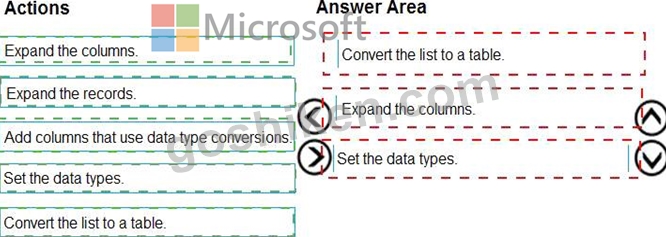
Explanation:
1- Convert list to table
2- Expand Column
3- Set Date type
Here is an example: https://youtu.be/B4kzyxnhQfI
The definition of the function which expand columns: https://docs.microsoft.com/en-us/powerquery-m/table- expandrecordcolumn
質問 # 234
You need to provide a user with the ability to add members to a workspace. The solution must use the principle of least privilege.
Which role should you assign to the user?
- A. Viewer
- B. Admin
- C. Contributor
- D. Member
正解:D
解説:
A Member can add members or others with lower permissions.
Note: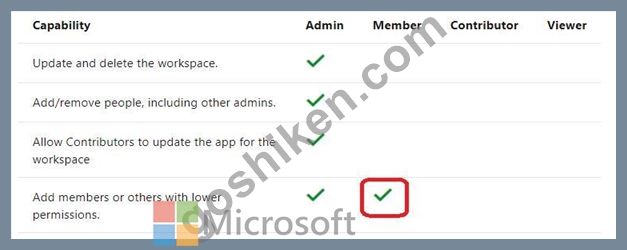
質問 # 235
You need to create a relationship in the data model for RLS.
What should you do? To answer, select the appropriate options in the answer area.
NOTE: Each correct selection is worth one point.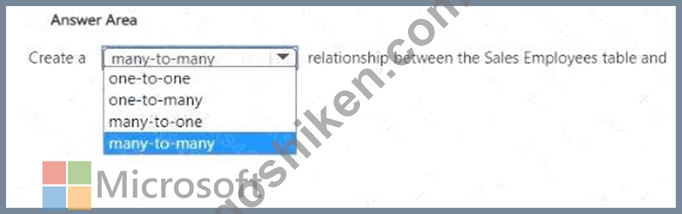
正解:
解説: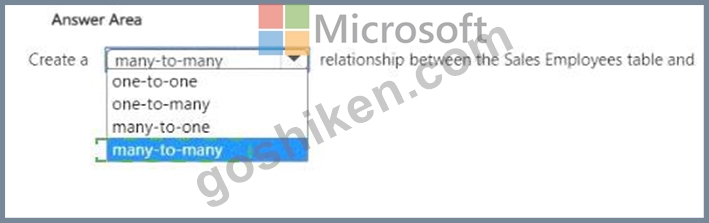
Explanation:
質問 # 236
Your organization has a team of power users who recently created 20 Power BI dashboards.
The power users share the dashboards with other users in the organization.
When the users attempt to access the dashboards, they receive the error message shown in the exhibit. (Click the Exhibit.)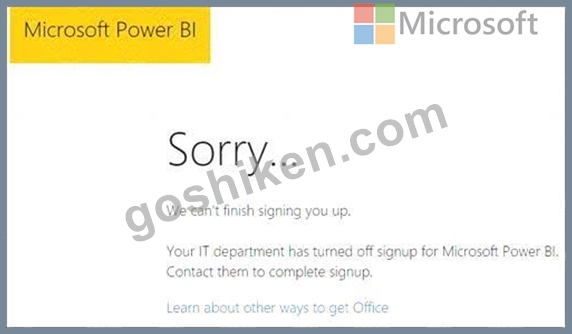
You need to ensure that all the users can access the dashboards.
What should you do first?
- A. From the Microsoft Office 365 Admin center, and the Power BI (free) subscription, and then assign a license to each user.
- B. From the properties of each dashboard, modify the Share dashboard settings.
- C. Instruct each user to install Microsoft Office 2016.
- D. From the Power BI Admin portal, modify the Privacy Settings.
正解:A
解説:
Explanation
References:
http://www.nubo.eu/en/blog/2016/12/Enable-PowerBI-On-Office-365/
質問 # 237
You create a data model in Power BI.
Report developers and users provide feedback that the data model is too complex.
The model contains the following tables.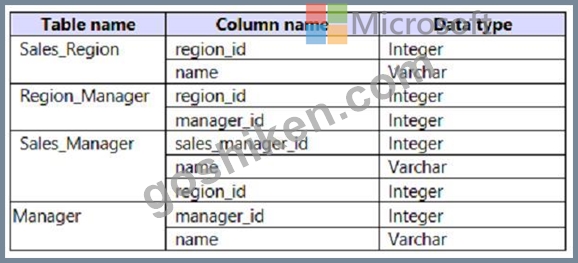
The model has the following relationships:
*There is a one-to-one relationship between Sales_Region and Region_Manager.
*There are more records in Manager than in Region_Manager, but every record in Region_Manager has a corresponding record in Manager.
*There are more records in Sales_Manager than in Sales_Region, but every record in Sales_Region has a corresponding record in Sales_Manager.
You need to denormalize the model into a single table. Only managers who are associated to a sales region must be included in the reports.
Which three actions should you perform in sequence? To answer, move the appropriate actions from the list of actions to the answer area and arrange them in the correct order.
NOTE: More than one order of answer choices is correct. You will receive credit for any of the correct orders you select.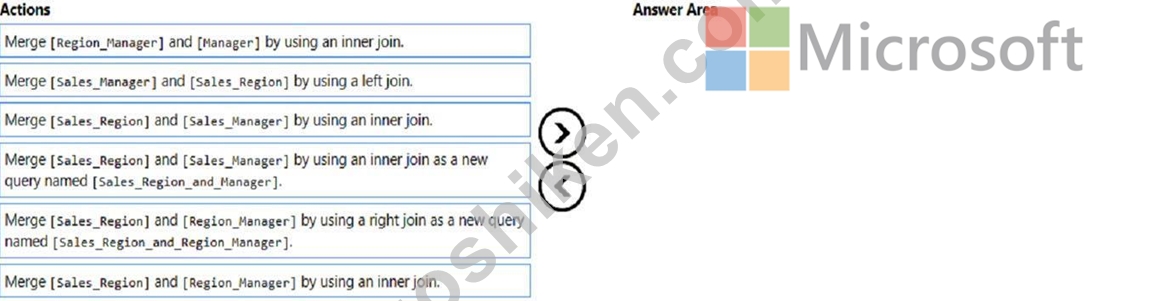
正解:
解説: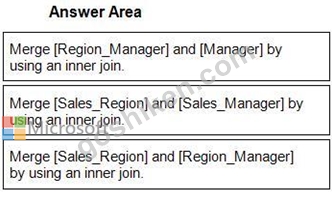
1 - Merge [Region_Manager] and [Manager] by using an inner join.
2 - Merge [Sales_Region] and [Sales_Manager] by using an inner join.
3 - Merge [Sales_Region] and [Region_Manager] by using an inner join.
質問 # 238
You need to create a DAX measure in the data model that only allows users to see projections at the appropriate levels of granularity.
How should you complete the measure? To answer, drag the appropriate values to the correct targets. Each value may be used once, more than once, or not at all. You may need to drag the split bar between panes or scroll to view content.
NOTE: Each correct selection is worth one point.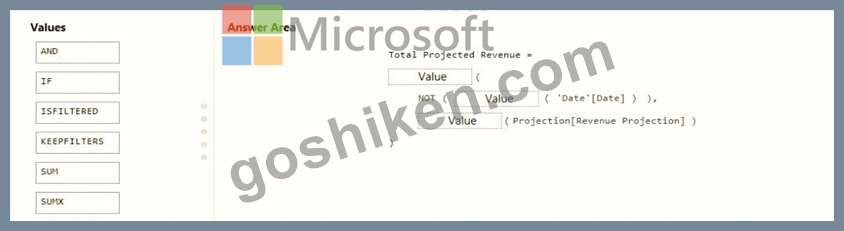
正解:
解説: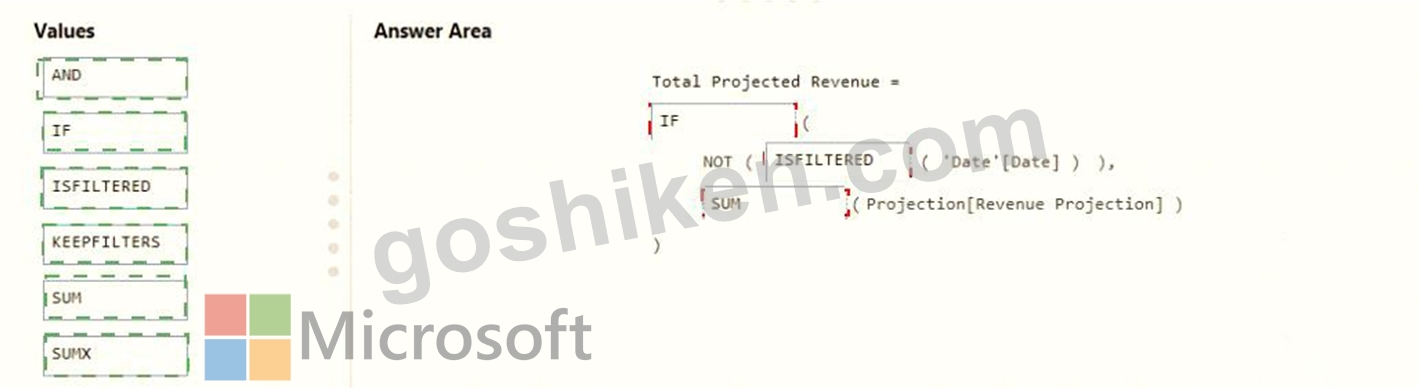
Explanation: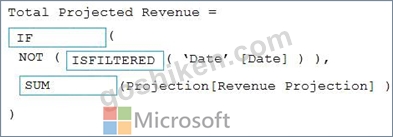
Scenario: Revenue projections are set at the monthly level and summed to show projections for the quarter.
Box 1: IF
Box 2: ISFILTERED
ISFILTERED returns TRUE when columnName is being filtered directly. If there is no filter on the column or if the filtering happens because a different column in the same table or in a related table is being filtered then the function returns FALSE.
Box 3: SUM
Reference:
https://docs.microsoft.com/en-us/dax/isfiltered-function-dax
質問 # 239
You are creating a Power Bi model and report.
You have a single table in a data mode) named Product Product contains the following fields:
* ID
* Name
* Color
* Category
* Total Sales
You need to create a calculated table that shows only the top eight products based on the highest value in Total Sales.
How should you complete the DAX expression? To answer, drag the appropriate values to the coned targets. Each value may be used once, more than once, or not at all. You may need to drag the split bar between panes or scroll to view content.
正解:
解説:
質問 # 240
......
最新PL-300テスト問題集を試そう!更新されたMicrosoft試験が合格できます:https://www.goshiken.com/Microsoft/PL-300-mondaishu.html
検証済み!PL-300問題集と解答でPL-300テストエンジン正確解答付き:https://drive.google.com/open?id=1Po8iX474ZcmngZqKR5cZrtl_hhrU3FpT