

2024年最新のPL-300問題集PDFでPL-300リアル試験問題解答
有効なPL-300テスト解答とMicrosoft PL-300試験PDF問題を試そう
PL-300試験の準備をするには、候補者はデータ分析の概念を十分に理解し、Power BIに精通している必要があります。また、候補者は、データモデリング、データの視覚化の作成と管理、およびPower BIを使用してデータ分析を実行する経験を持つ必要があります。 Microsoftは、オンラインコース、練習テスト、学習ガイドなど、候補者が試験の準備を支援するためのさまざまなリソースを提供しています。
質問 # 35
Note: This question is part of a series of questions that use the same scenario. For your convenience, the scenario is repeated in each question. Each question presents a different goal and answer choices, but the text of the scenario is the same in each question in this series.
You have a Microsoft SQL Server database that contains the following tables.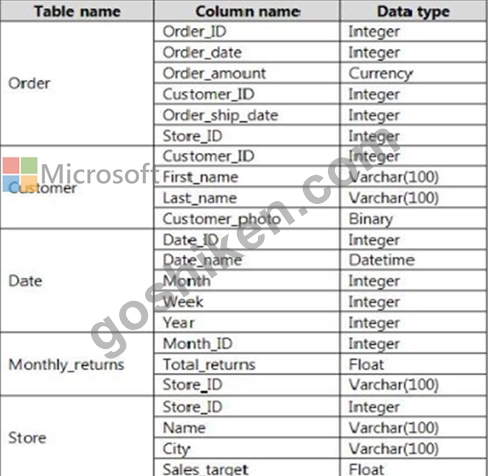
The following columns contain date information:
- Date[Month] in the mmyyyy format
- Date[Date_ID] in the ddmmyyyy format
- Date[Date_name] in the mm/dd/yyyy format
- Monthly_returns[Month_ID] in the mmyyyy format
The Order table contains more than one million rows.
The Store table has a relationship to the Monthly_returns table on the Store_ID column. This is the only relationship between the tables.
You plan to use Power BI Desktop to create an analytics solution for the data.
You need to create a relationship between the Order table and the Store table on the Store_ID column.
What should you do before you create the relationship?
- A. In the Order table query, use the Table.TrasformColumnTypes function.
- B. In the Order table query, use the Table.TrasformRows function.
- C. In the Store table query, use the Table.TrasformColumnTypes function.
- D. In the Store table query, use the Table.TrasformRows function.
正解:C
質問 # 36
You have a Power Bl report that contains three pages. The pages are used to analyze sales across various countries.
You add a sheer named Country to each page of the report.
You need to configure the report to meet the following requirements:
* When a user selects a country on the first page, the report must filter the other pages.
* The second and third pages must display only the filtered results.
Which task should you perform for each requirement? To answer, drag the appropriate task to the correct requirement. Each task may be used once, more than once, or not at all. You may need to drag the split bar between panes or scroll to view content.
NOTE Each correct selection is worth one point.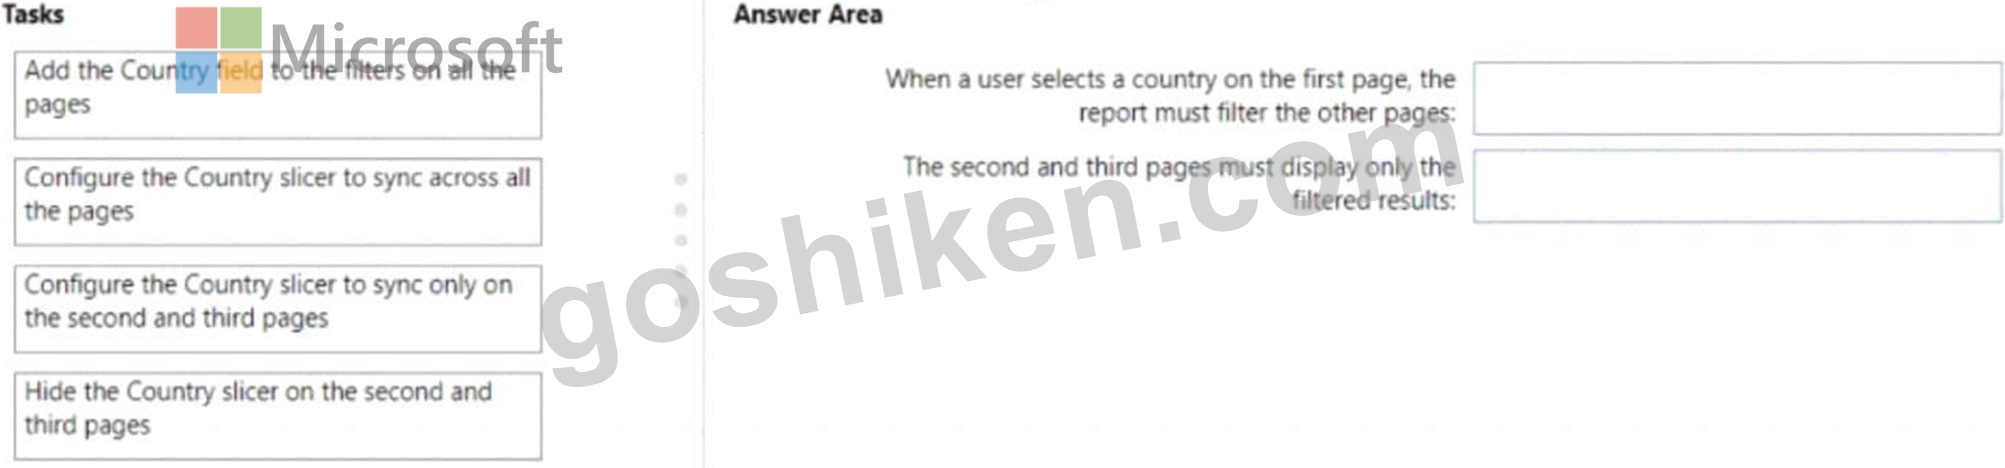
正解:
解説: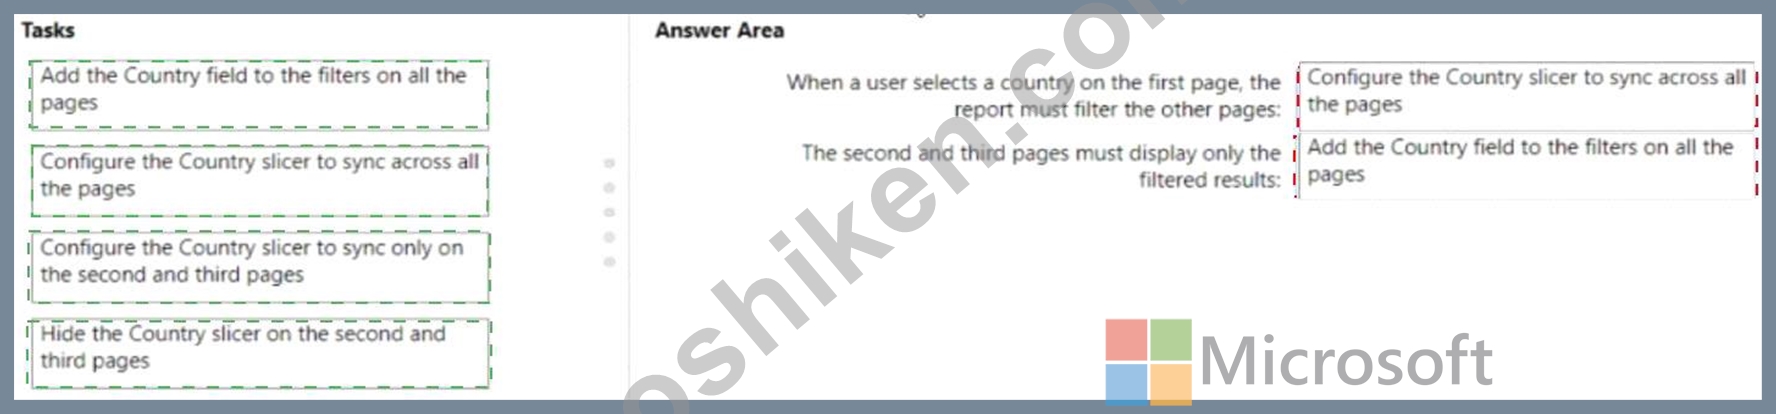
Explanation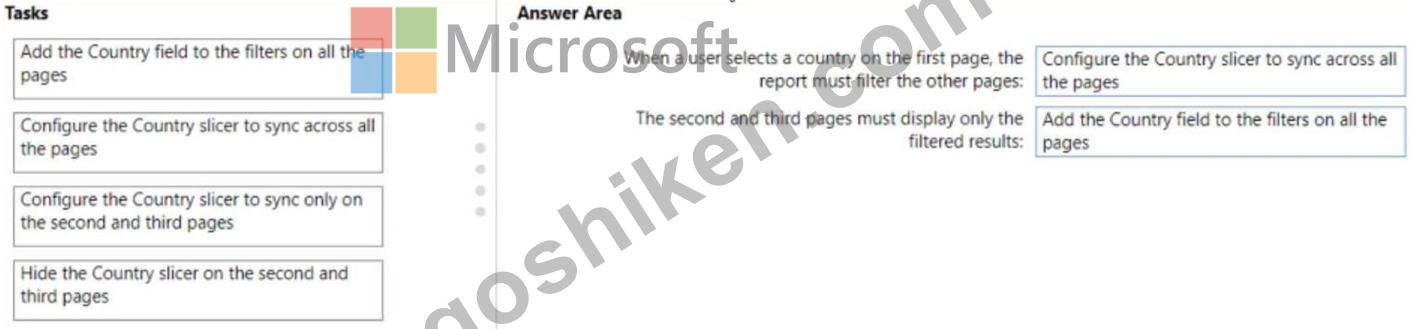
質問 # 37
You need to create a Power Bl report. The first page or the report must contain the following two views:
* Sales By Postal Code
* Sales by Month
Both views must display a slicer to select a value for a field named Chain.
The Sales By Postal Code view must display a map visual as shown in the following exhibit.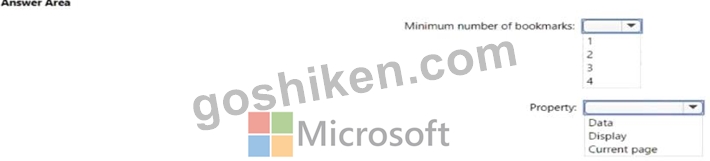
正解:
解説: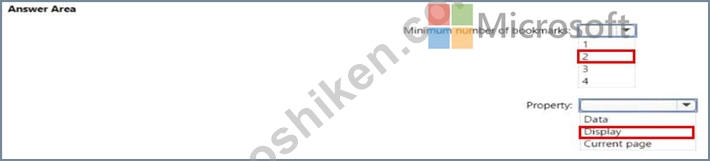
質問 # 38
You open powerbi.com as shown in the following exhibit.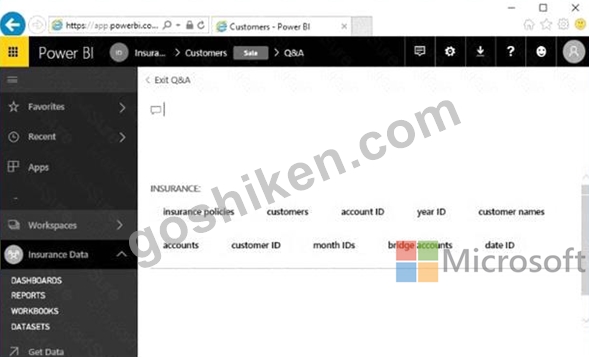
Use the drop-down menus to select the answer choice that completes each statement based on the information presented in the graphic.
NOTE: Each correct selection is worth one point.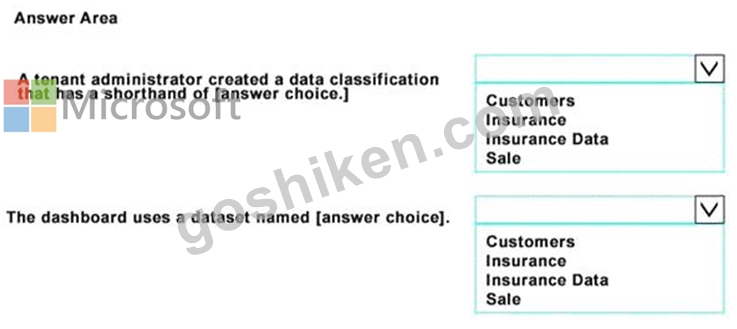
正解:
解説: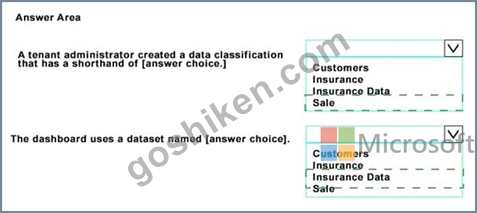
Explanation:
Graphical user interface, text, application, Word, email Description automatically generated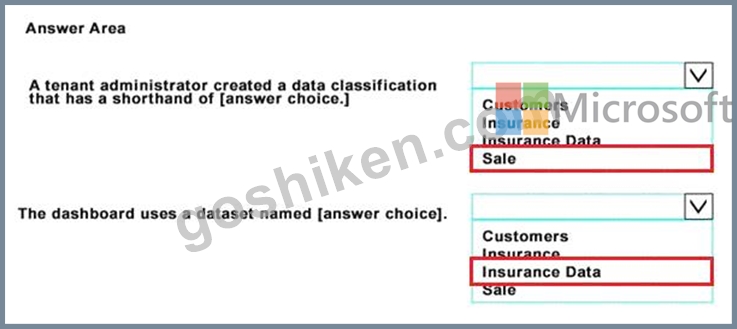
References: https://docs.microsoft.com/en-us/power-bi/service-data-classification
質問 # 39
You receive revenue data that must be included in Microsoft Power Bl reports.
You perform an initial load of the data from a Microsoft Excel source as shown in the following exhibit.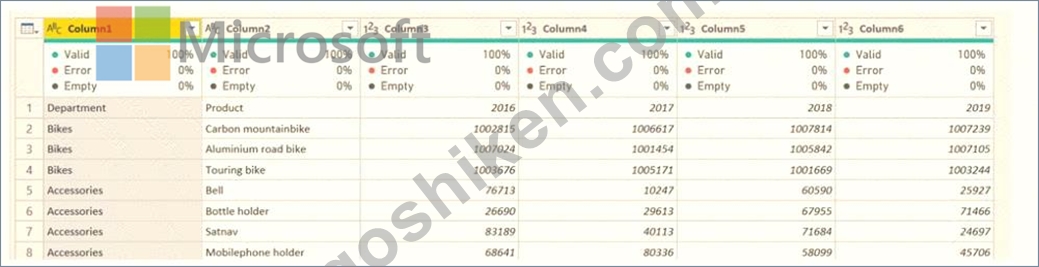
You plan to create several visuals from the data, including a visual that shows revenue split by year and product.
You need to transform the data to ensure that you can build the visuals. The solution must ensure that the columns are named appropriately for the data that they contain.
Which three actions should you perform in sequence? To answer, move the appropriate actions from the list of actions to the answer area and arrange them in the correct order.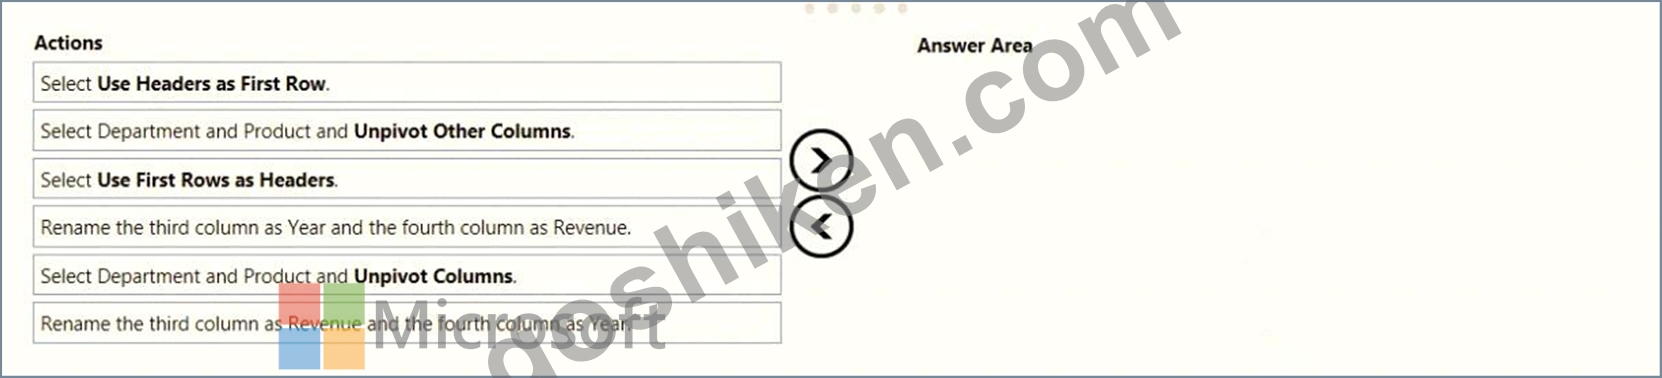
正解:
解説: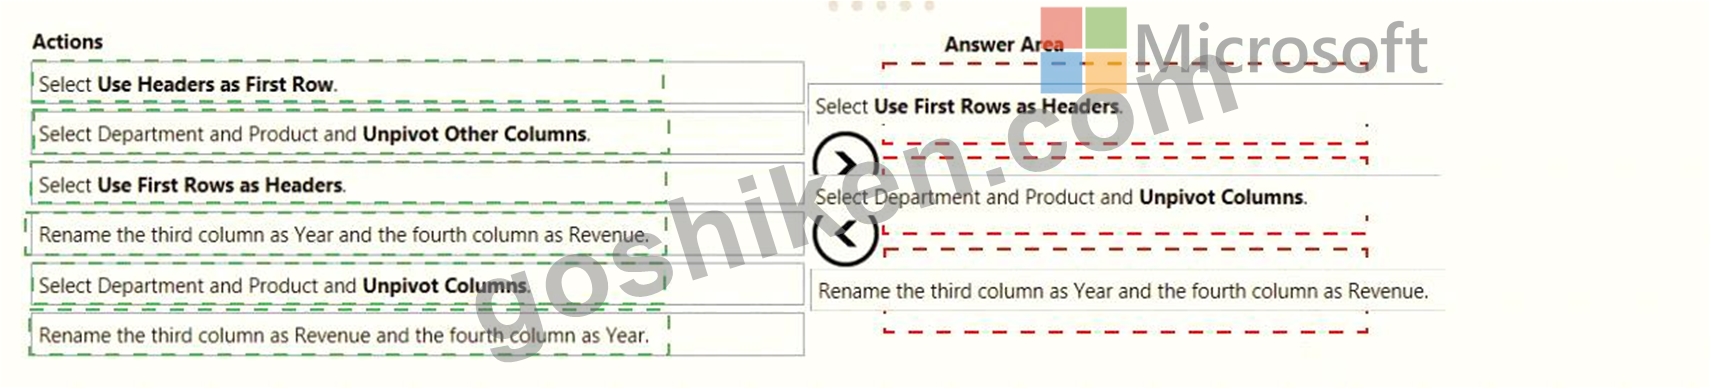
Explanation:
Text Description automatically generated with medium confidence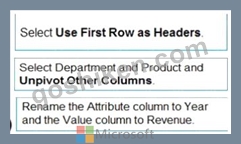
Step 1: Select Use Header as First Row.
Step 2: Select Department and Product and Unpivot Other Columns
Unpivot Other Columns: This command unpivots unselected columns. Use this command in a query when not all columns are known. New columns added during a refresh operation are also unpivoted.
Step 3: Rename the Attribute column to Year and the Value column to Revenue.
You might want to unpivot data, sometimes called flattening the data, to put it in a matrix format so that all similar values are in one column. This is necessary, for example, to create a chart or a report.
Chart Description automatically generated with medium confidence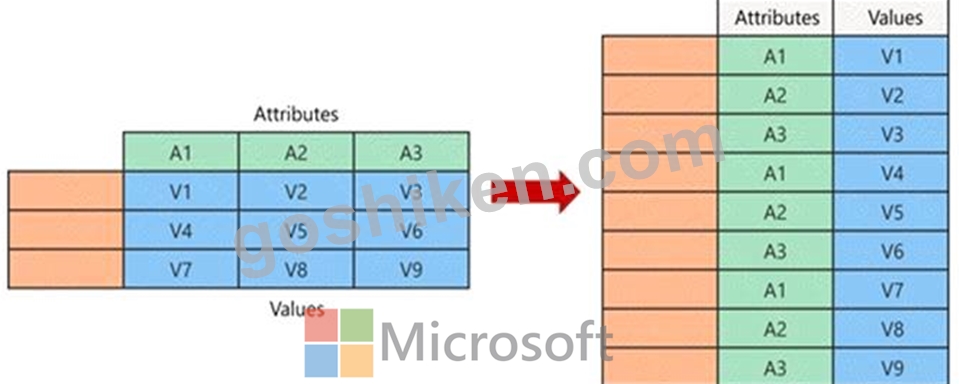
When you unpivot, you unpack the attribute-value pairs that represent an intersection point of the new columns and re-orient them into flattened columns:
Values (in blue on the left) are unpivoted into a new column (in blue on the right).
Attributes (in green on the left) are unpivoted into a new column (in green on the right) and duplicates are correspondingly mapped to the new Values column.
Reference:
https://support.microsoft.com/en-us/office/unpivot-columns-power-query-0f7bad4b-9ea1-49c1-9d95-f588221c70
質問 # 40
You have a query named All Sales that imports sales data into a Power BI model.
You plan to create a star schema by separating columns into separate queries and performing further transformations. The solution must meet the following requirements:
* Use All Sales as the source for three other queries named Sales Fact Product Dimension, and Customer Dimension.
* Minimize maintenance effort.
What should you do to create the Sales Fact query, and for which query should you clear Enable load? To answer, select the appropriate options in the answer area.
NOTE: Each correct selection is worth one point.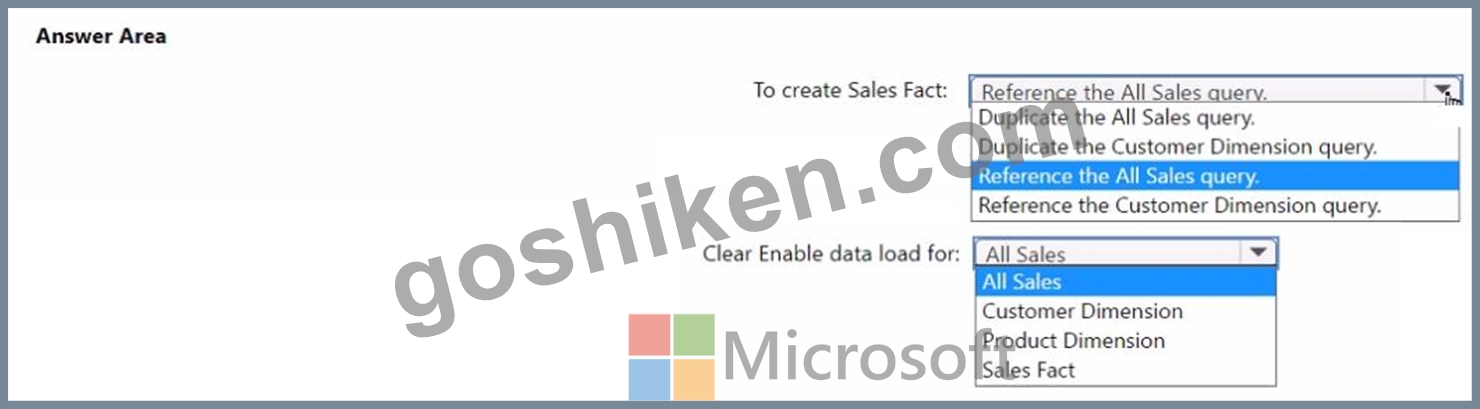
正解:
解説: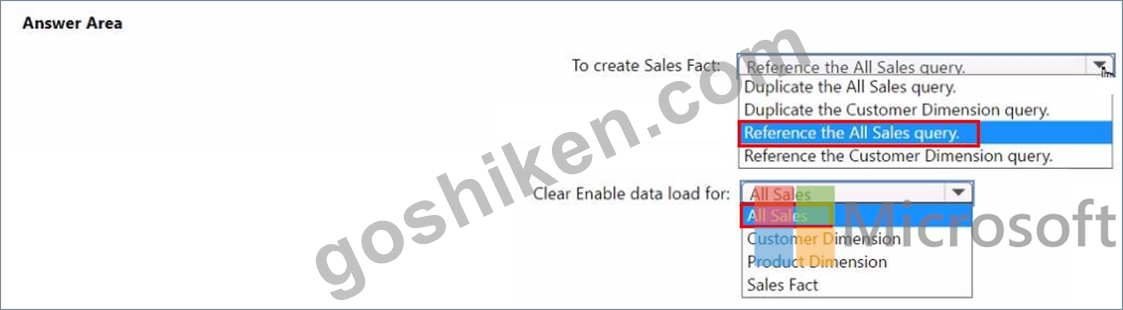
質問 # 41
You have a Power Bl report that contains three pages. The pages are used to analyze sales across various countries.
You add a sheer named Country to each page of the report.
You need to configure the report to meet the following requirements:
* When a user selects a country on the first page, the report must filter the other pages.
* The second and third pages must display only the filtered results.
Which task should you perform for each requirement? To answer, drag the appropriate task to the correct requirement. Each task may be used once, more than once, or not at all. You may need to drag the split bar between panes or scroll to view content.Ther NOTE Each correct selection is worth one point.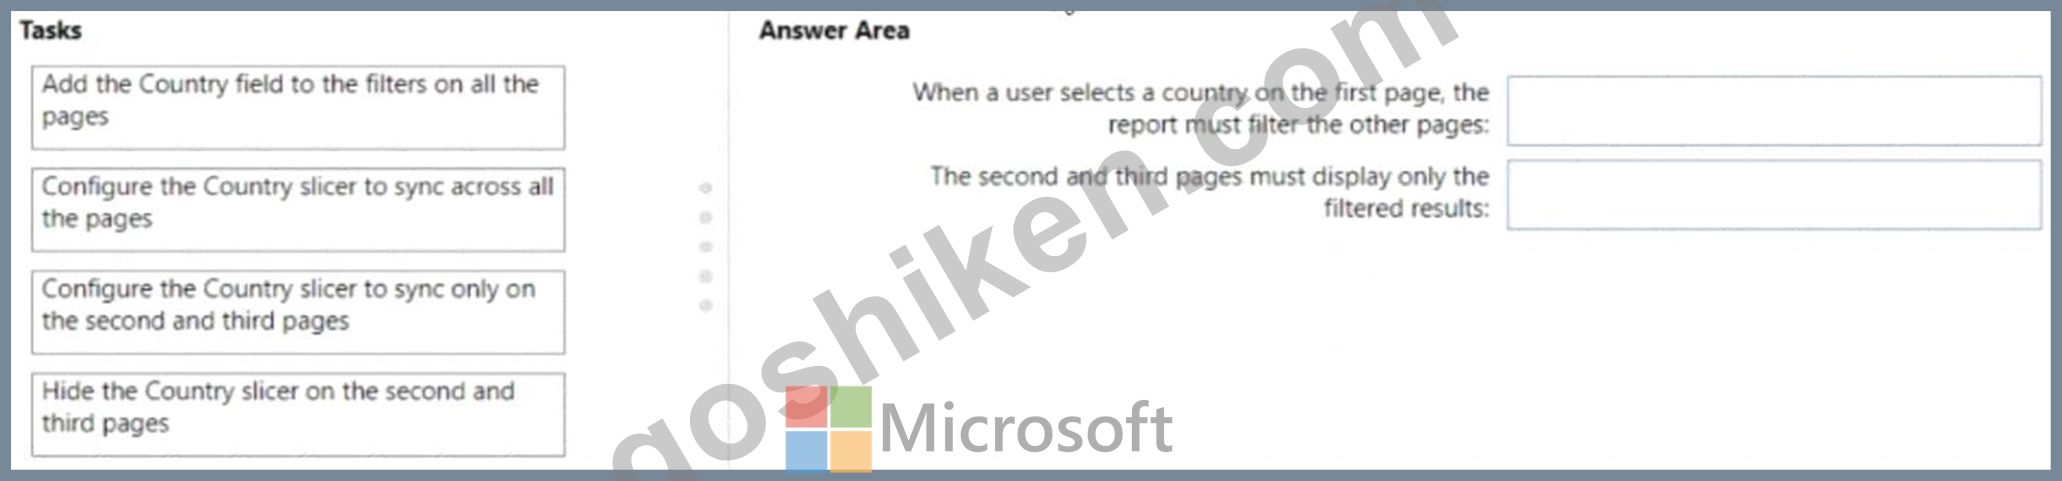
正解:
解説: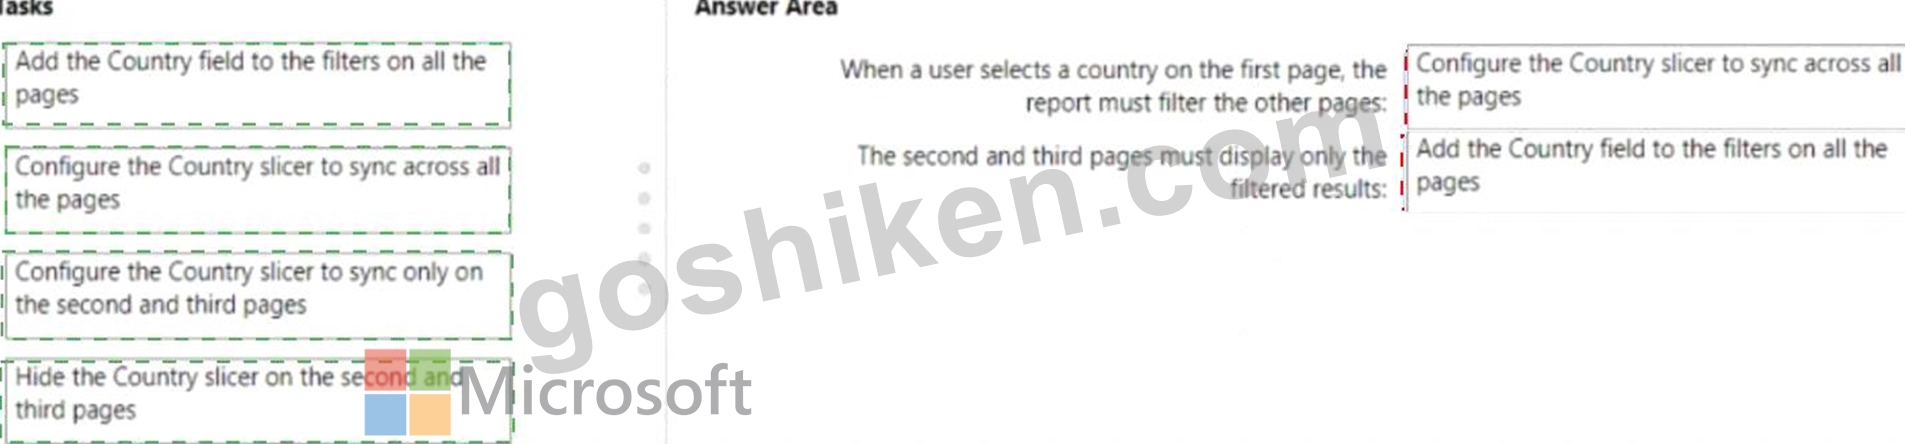
Explanation: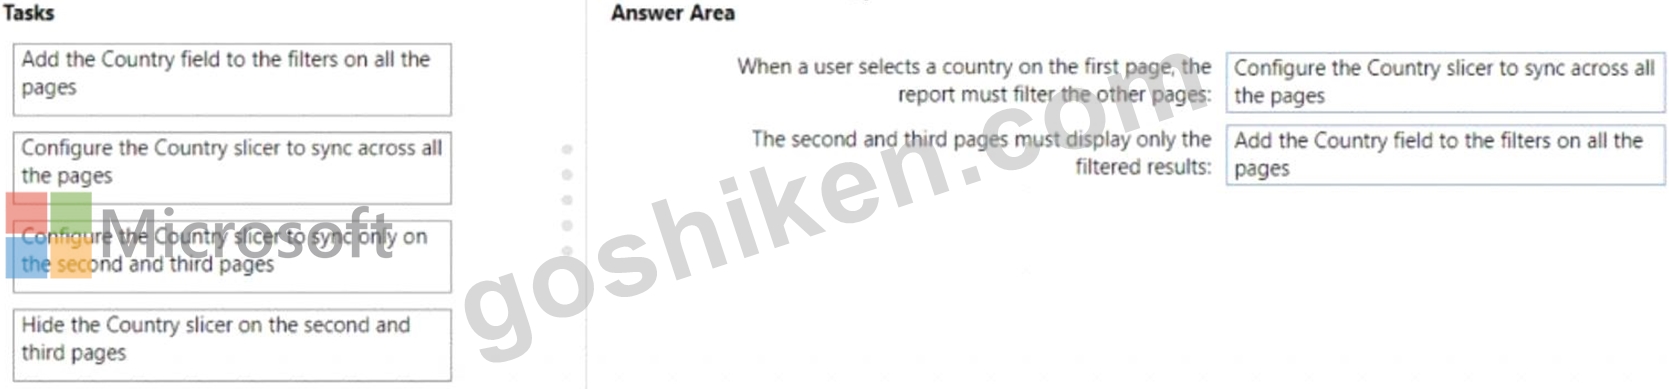
質問 # 42
You are creating an analytics report that will consume data from the tables shown in the following table.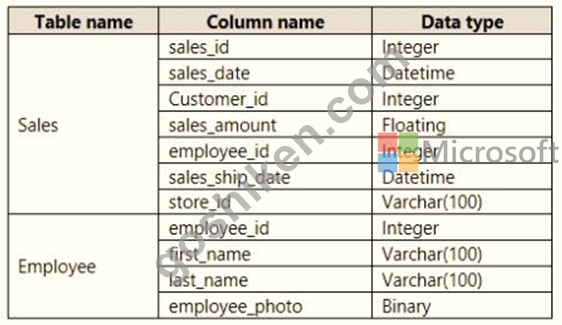
There is a relationship between the tables.
There are no reporting requirements on employeejd and employee_photo.
You need to optimize the data model
What should you configure for employeejd and employee.photo? To answer, select the appropriate options in the answer area.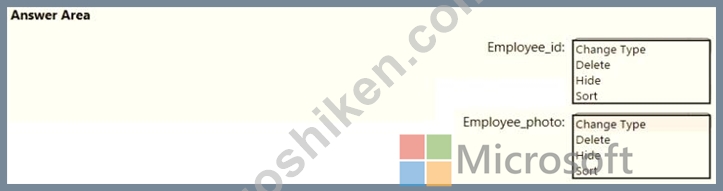
正解:
解説: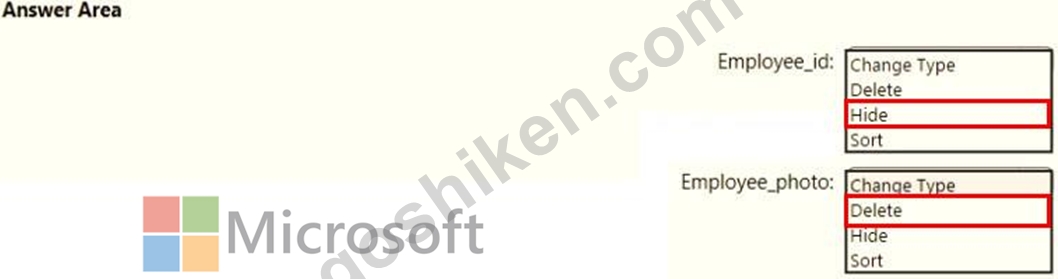
Reference:
https://tessellationtech.io/optimizing-power-bi-reports/
質問 # 43
You have an Azure SQL database that contains sales transactions. The database is updated frequently.
You need to generate reports from the data to detect fraudulent transactions. The data must be visible within five minutes of an update.
How should you configure the data connection?
- A. Set the Command timeout in minutes setting.
- B. Add a SQL statement.
- C. Set Data Connectivity mode to Import.
- D. Set Data Connectivity mode to DirectQuery.
正解:D
解説:
With Power BI Desktop, when you connect to your data source, it's always possible to import a copy of the data into the Power BI Desktop. For some data sources, an alternative approach is available: connect directly to the data source using DirectQuery.
DirectQuery: No data is imported or copied into Power BI Desktop. For relational sources, the selected tables and columns appear in the Fields list. For multi-dimensional sources like SAP Business Warehouse, the dimensions and measures of the selected cube appear in the Fields list. As you create or interact with a visualization, Power BI Desktop queries the underlying data source, so you're always viewing current data.
Reference:
https://docs.microsoft.com/en-us/power-bi/connect-data/desktop-use-directquery
質問 # 44
You need to create a visual as shown in the following exhibit.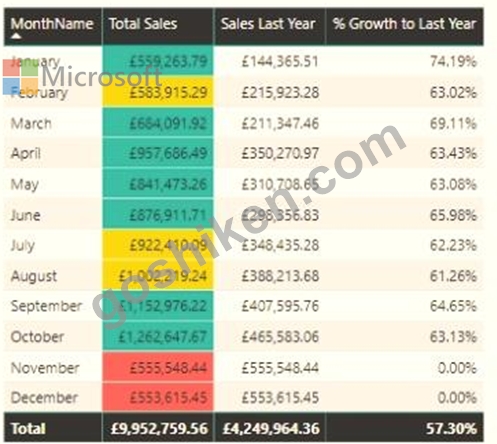
The indicator color for Total Sales will be based on % Growth to Last Year.
The solution must use the existing calculations only.
How should you configure the visual? To answer, select the appropriate options in the answer area.
NOTE: Each correct selection is worth one point.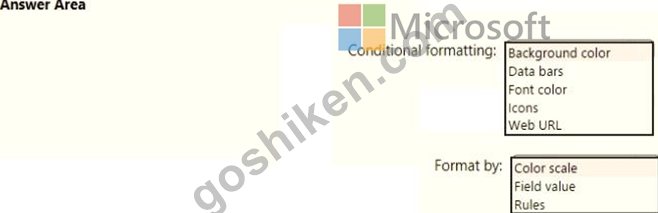
正解:
解説: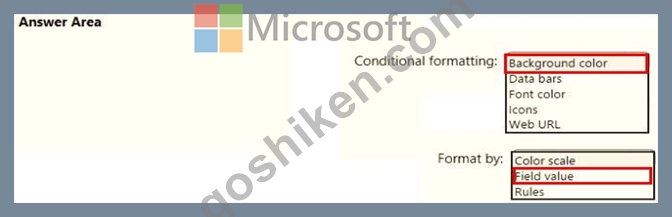
Reference:
https://docs.microsoft.com/en-us/power-bi/create-reports/desktop-conditional-table-formatting
質問 # 45
You are creating an analytics report that will consume data from the tables shown in the following table.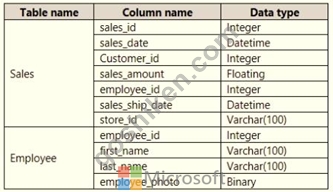
There is a relationship between the tables.
There are no reporting requirements on employeejd and employee_photo.
You need to optimize the data model
What should you configure for employeejd and employee.photo? To answer, select the appropriate options in the answer area.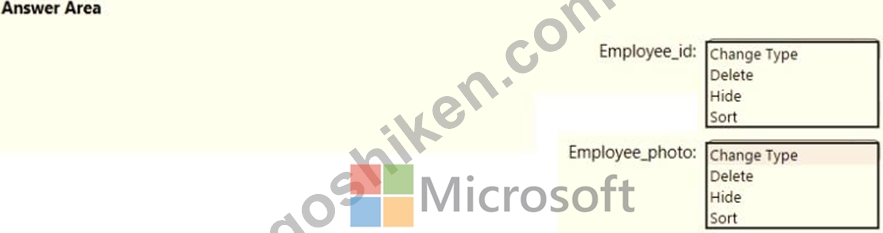
正解:
解説: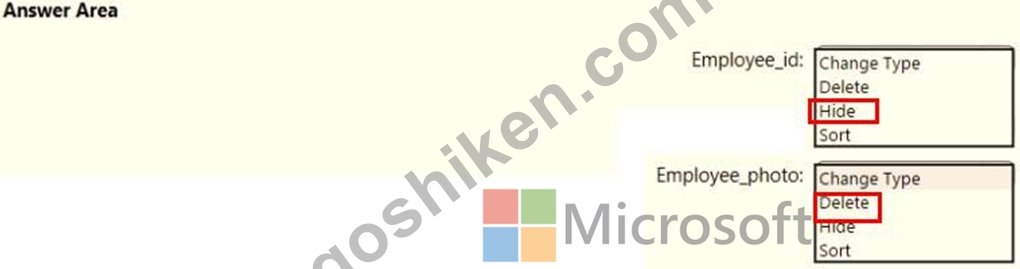
Reference:
https://tessellationtech.io/optimizing-power-bi-reports/
質問 # 46
You have the tables shown in the following table.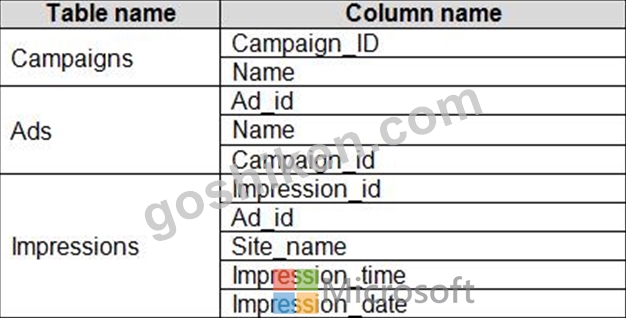
The Impressions table contains approximately 30 million records per month.
You need to create an ad analytics system to meet the following requirements:
Present ad impression counts for the day, campaign, and Site_name. The analytics for the last year are required.
Minimize the data model size.
Which two actions should you perform? Each correct answer presents part of the solution.
NOTE: Each correct selection is worth one point.
- A. Group the impressions by Ad_id, Site_name, and Impression_date.
Aggregate by using the CountRows function. - B. Create a calculated measure that aggregates by using the COUNTROWS function.
- C. Create one-to-many relationships between the tables.
- D. Create a calculated table that contains Ad_id, Site_name, and Impression_date.
正解:B、C
質問 # 47
You have a Power Bi report that contains five bookmarks.
You need to add an object to the report from which users can navigate between three specific bookmarks.
How should you complete the task? To answer, drag the appropriate actions to the correct steps, each action may be used once more than once, or not at all. You may need to drag the split bar between panes or scroll lo view content.
NOTE: Each correct selection is worth one point.
正解:
解説:
質問 # 48
Note: This question is a part of a series of questions that present the same scenario. For your convenience, the scenario is repeated in each question. Each question presents a different goal and answer choices, but the text of the scenario is exactly the same in each question in this series.
Start of repeated scenario
You have a Microsoft SQL Server database that has the tables shown in the Database Diagram exhibit. (Click the Exhibit.)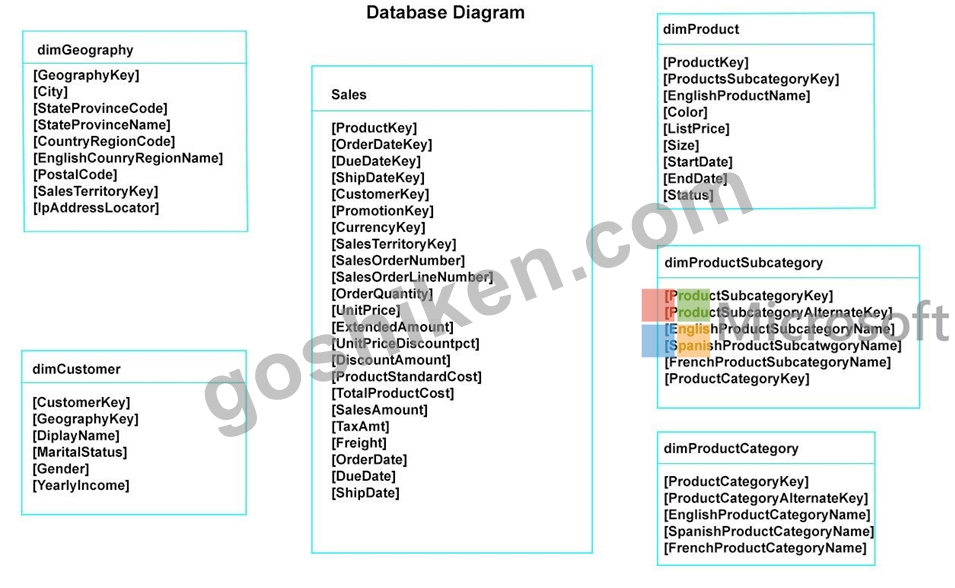
You plan to develop a Power BI model as shown in the Power BI Model exhibit. (Click the Exhibit).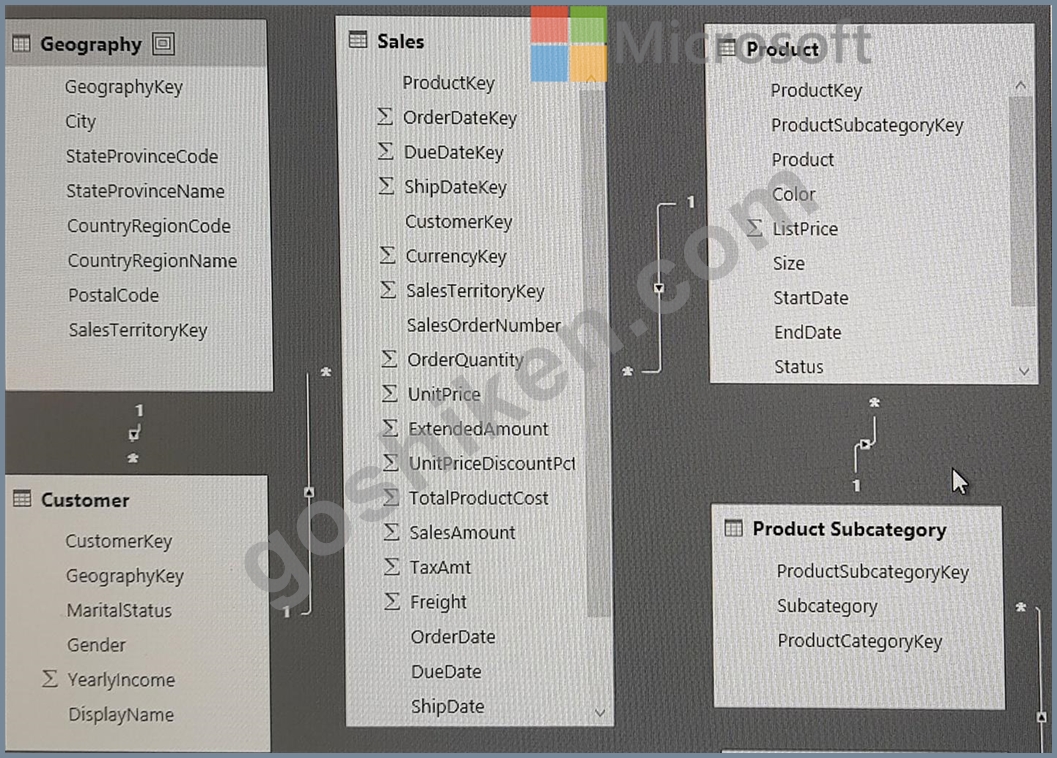
You plan to use Power BI to import data from 2013 to 2015.
Product Subcategory [Subcategory] contains NULL values.
End of repeated scenario.
You implement the Power BI model.
You need to add a measure to rank total sales by product. The results must appear as shown in the following table.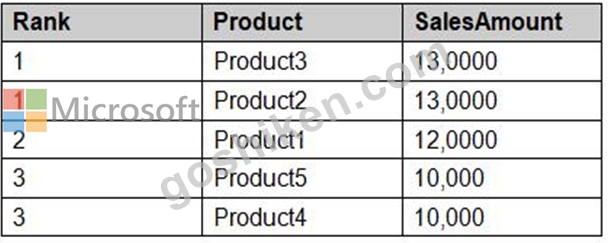
Which DAX formula should you use?
- A. Product Ranking= RANKX (ALL, ('Product'), [SalesAmount], , DESC, Skip)
- B. Product Ranking= RANKX (Product, [SalesAmount], , DESC, Skip)
- C. Product Ranking= RANKX (ALL ('Product'), [SalesAmount], , Asc, Dense
- D. Product Ranking= RANKX (ALL, ('Product'), [SalesAmount], , DESC, Dense)
正解:D
質問 # 49
You have a Power BI model that contains a table named Sales. Sales has the following three measures:
* A measure named Total Sales Last Year that displays the sales from the previous calendar year. The
* current value is 32.89 million.
* A measure named Total Sales This Year that displays the sales from the current calendar year. The current value is 11.69 million.
* A measure named Total Sales Difference that uses a DAX formula of Sales[Last Year] - Sales[This Year].
You need to create the following visualization.
How should you configure the visualization? To answer, drag the appropriate measures to the correct fields.
Each value may be used once, more than once, or not at all. You may need to drag the split bar between panes or scroll to view content.
NOTE: Each correct selection is worth one point.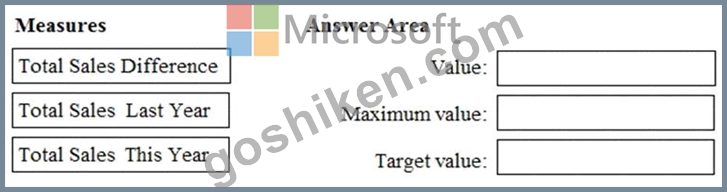
正解:
解説: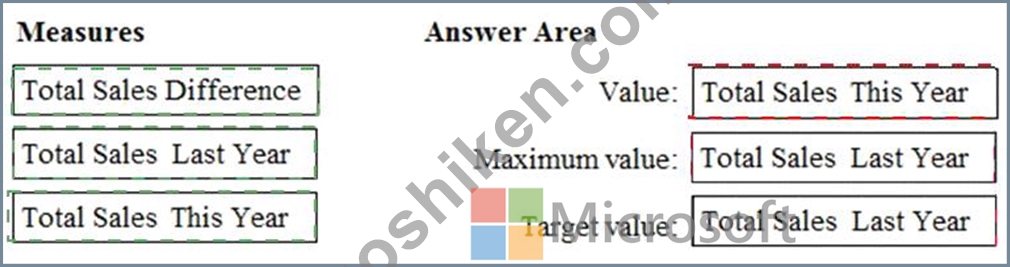
Explanation:
Diagram, table Description automatically generated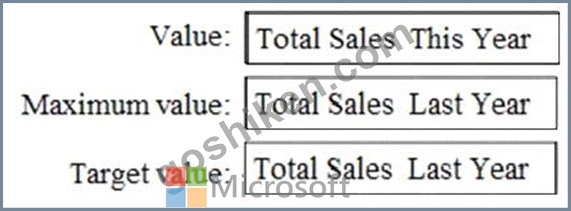
References:
https://docs.microsoft.com/en-us/power-bi/visuals/power-bi-visualization-radial-gauge-charts
質問 # 50
You have a Power BI model that has the following tables:
* Product (Product_id, Product_Name)
* Sales (Order_id, Order_Date, Product_id, Salesperson_id, Sales_Amount)
* Salesperson (Salesperson_id, Salesperson_name, address)
You plan to create the following measure.
Measure1 = DISTINCTCOUNT(Sales[ProductID])
You need to create the following relationships:
* Sales to Product
* Sales to Salesperson
The solution must ensure that you can use Measure1 to display the count of products sold by each salesperson.
How should you configure the relationships? To answer, select the appropriate options in the answer area.
NOTE: Each correct selection is worth one point.
正解:
解説:
Explanation
Graphical user interface, text Description automatically generated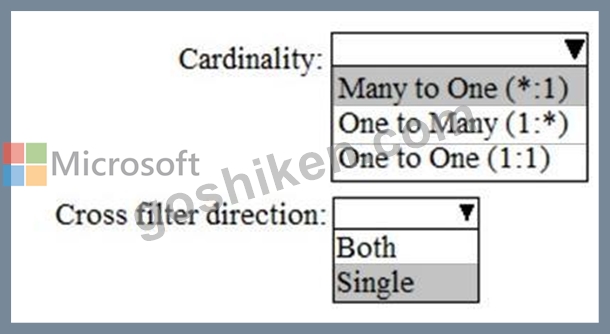
質問 # 51
You have a Microsoft Power Bl dashboard. The report used to create the dashboard uses an imported dataset from a Microsoft SQL Server data source. The dashboard is shown in the exhibit. (Click the Exhibit tab.)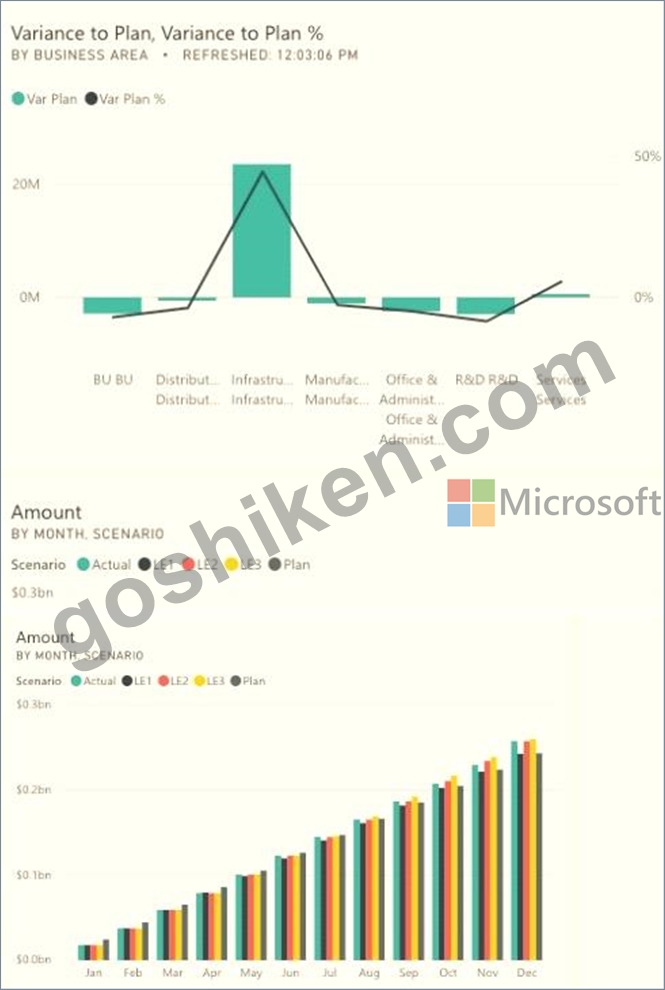
What occurred at 12:03:06 PM?
- A. A user added a comment to a tile.
- B. The dashboard tile cache refreshed.
- C. A user pressed F5
- D. A new transaction was added to the data source.
正解:B
解説:
Reference:
https://docs.microsoft.com/en-us/power-bi/connect-data/refresh-data
質問 # 52
You have a report in Power BI Desktop as shown in the following exhibit.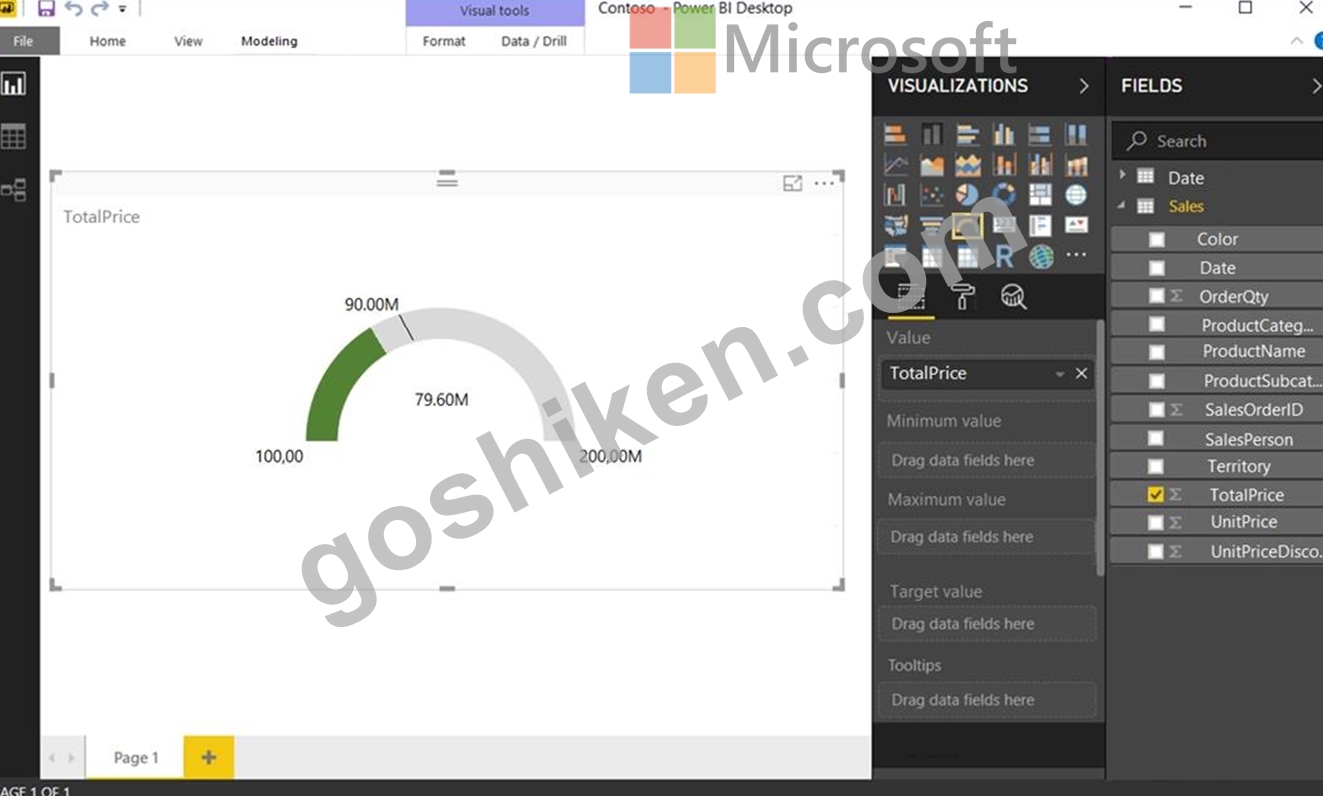
Use the drop-down menus to select the answer choice that completes each statement based on the information presented in the graphic.
Note: Each correct selection is worth one point.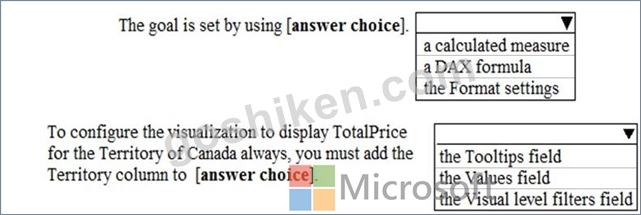
正解:
解説: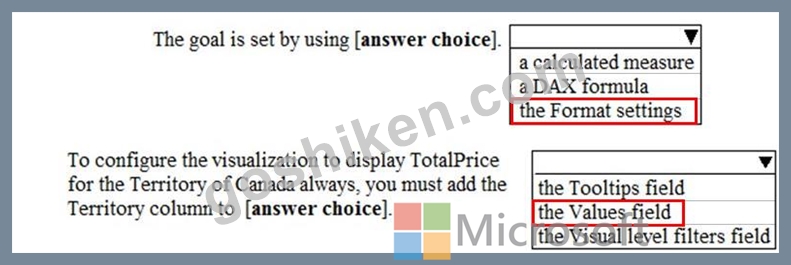
質問 # 53
You import a Power Bl dataset that contains the following tables:
* Date
* Product
* Product Inventory
The Product inventory table contains 25 million rows. A sample of the data is shown in the following table.
The Product Inventory table relates to the Date table by using the DateKey column. The Product inventory table relates to the Product table by using the ProductKey column. You need to reduce the size of the data model without losing information. What should you do?
- A. Change Summarization for DateKey to Don't Summarize.
- B. Remove the relationship between Date and Product Inventory.
- C. Remove MovementDate.
- D. Change the data type of UnitCost to Integer.
正解:C
質問 # 54
You are creating a Power Bi model and report.
You have a single table in a data mode) named Product Product contains the following fields:
* ID
* Name
* Color
* Category
* Total Sales
You need to create a calculated table that shows only the top eight products based on the highest value in Total Sales.
How should you complete the DAX expression? To answer, drag the appropriate values to the coned targets.
Each value may be used once, more than once, or not at all. You may need to drag the split bar between panes or scroll to view content.
正解:
解説:
Explanation
質問 # 55
You use an R visual to produce a map of 500,000 customers. You include the values of CustomerID, Latitude, and Longitude in the fields sent to the visual. Each customer ID is unique.
In powerbi.com, when users load the visual, they only see some of the customers.
What is the cause of the issue?
- A. The data is deduplicated.
- B. Too many records were sent to the visual.
- C. The visual was built by using a different version of R.
- D. The data comes from a Microsoft SQL Server source.
正解:B
解説:
R visuals in the Power BI service have a few limitations including:
Data size limitations - data used by the R visual for plotting is limited to 150,000 rows. If more than 150,000 rows are selected, only the top 150,000 rows are used and a message is displayed on the image. Additionally, the input data has a limit of 250 MB.
Reference:
https://docs.microsoft.com/en-us/power-bi/visuals/service-r-visuals
質問 # 56
You are modeling data in table named SalesDetail by using Microsoft Power Bl.
You need to provide end users with access to the summary statistics about the SalesDetail dat a. The users require insights on the completeness of the data and the value distributions.
Which three actions should you perform in sequence? To answer, move the appropriate actions from the list of actions to the answer area and arrange them in the correct order.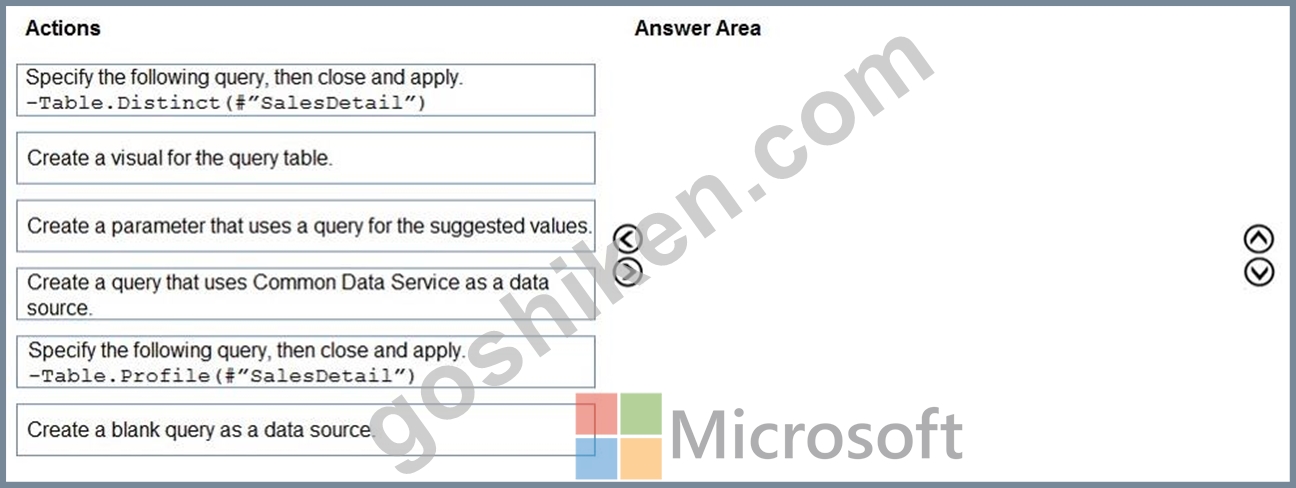
正解:
解説: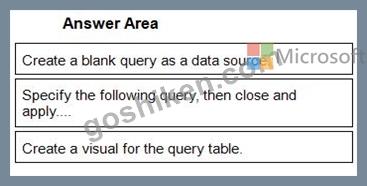
1 - Create a blank query as a data source.
2 - Specify the following query, then close and apply....
3 - Create a visual for the query table.
質問 # 57
Note: This question is part of a series of questions that present the same scenario. Each question in the series contains a unique solution that might meet the stated goals. Some question sets might have more than one correct solution, while others might not have a correct solution.
After you answer a question in this section, you will NOT be able to return to it. As a result, these questions will not appear in the review screen.
From Power Query Editor, you profile the data shown in the following exhibit.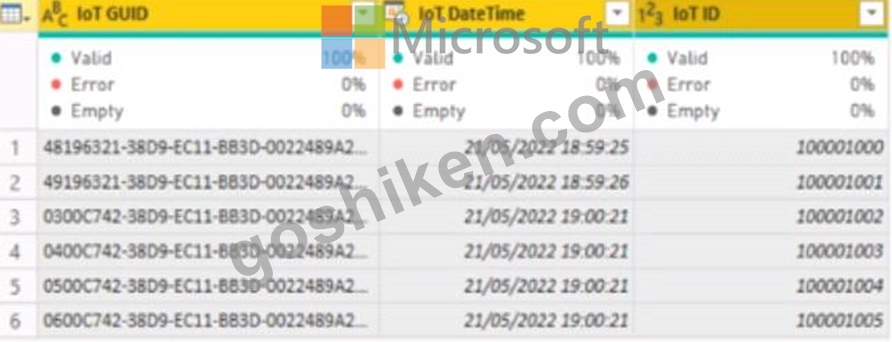
The IoT GUID and IoT ID columns are unique to each row in query.
You need to analyze IoT events by the hour and day of the year. The solution must improve dataset performance.
Solution: You split the loT DateTime column into a column named Date and a column named Time.
Does this meet the goal?
- A. No
- B. Yes
正解:A
質問 # 58
You need to create the Top Customers report.
Which type of filter should you use, and at which level should you apply the filter? To answer, select the appropriate options in the answer area.
NOTE; Each correct selection is worth one point.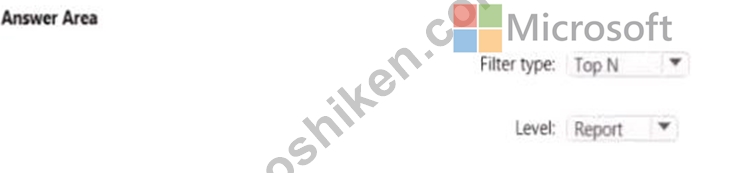
正解:
解説:
See the answer as below in explanation.
Explanation:
Answer as below
A picture containing background pattern Description automatically generated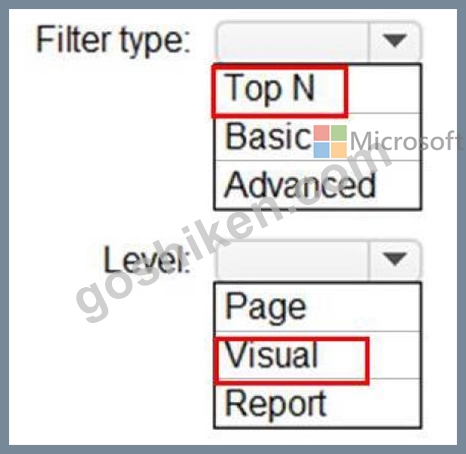
質問 # 59
......
PL-300認定を獲得することは、雇用主と同僚に、候補者がデータ分析にPower BIを効果的に使用するスキルを持っていることを示しています。この認定は、個人がデータ分析においてキャリアを進め、スキルの認識を得るための優れた方法です。さらに、認定を獲得すると、給与の増加、昇進の機会、および雇用保障の向上につながる可能性があります。
PL-300試験問題集でPDF問題とテストエンジン:https://www.goshiken.com/Microsoft/PL-300-mondaishu.html
実際に出るPL-300試験問題集には正確で更新された問題:https://drive.google.com/open?id=1Gm2ZoERw5tUbXMvNrmtVAYHxBxITpTxw